April 24, 2017
Correction!
Starting March, the stock price is on the decline. The stock is leading the market correction mode. True or true?
GS Goldman Sachs Group Inc Daily Chart and Channels
Picture worth a thousand words.
The price keeps forming lower low. Connect the the to high and draw a trendline. Copy the trendline and connect the low. This forms the channel. The price trapped inside the channel.
The price structure will only change when the price breakout either higher or lower of the channel.
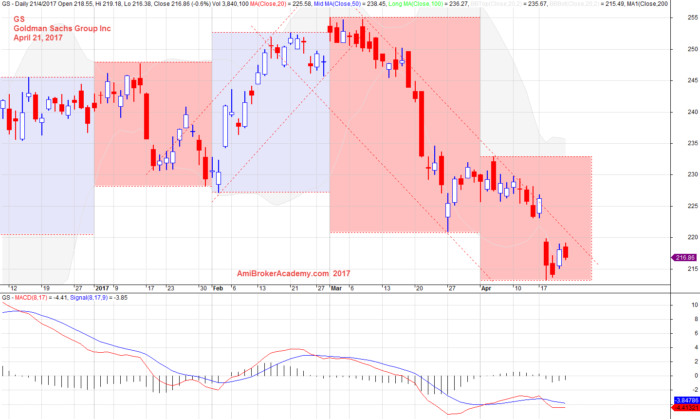
April 21, 2017 Goldman Sachs Group Inc and Channels
GS Goldman Sachs Group and Support and Resistance
Picture worth a thousand words.
The price fail to breakout higher in March, the price action start to drip south. The price breakout lower than the January and February low and formed a lower low.
Now the price breakout lower than the March low to become the low lower than January, February, and March. Will the current low is the low for 2017. Will see.
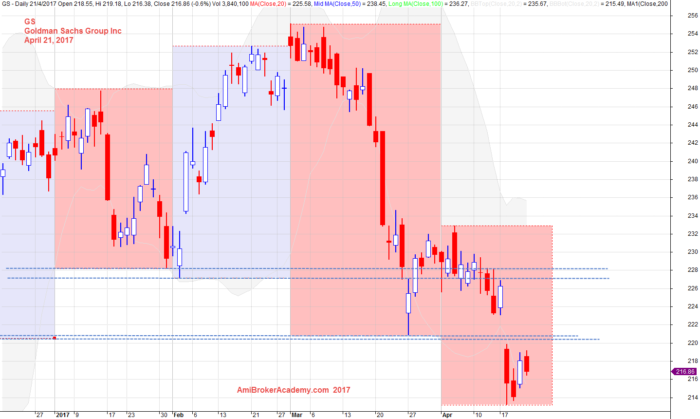
April 21, 2017 Goldman Sachs Group Inc and Support and Resistance
GS Goldman Sachs Group Daily Chart
What is your reading on the price action chart of GS without any lines and only the BB.
I see a head and shoulders. I see the right shoulder is touching the neckline. …
Can the price stop at the neckline? WOMD.
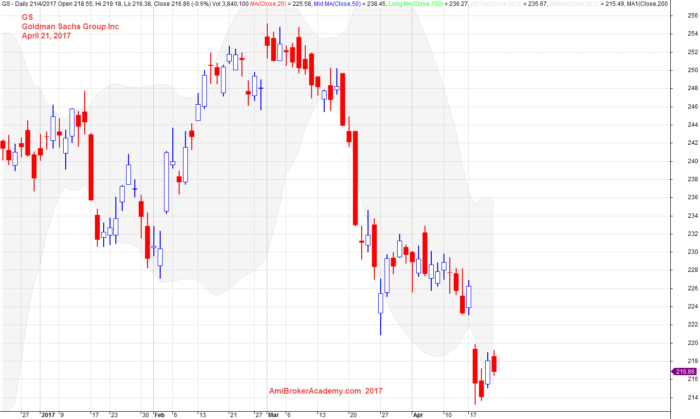
April 21, 2017 Goldman Sachs Group Inc Daily
Nothing is 100%!
Happy learning.
Moses Stock Analysis
AmiBrokerAcademy.com
Disclaimer
The above result is for illustration purpose. It is not meant to be used for buy or sell decision. We do not recommend any particular stocks. If particular stocks of such are mentioned, they are meant as demonstration of Amibroker as a powerful charting software and MACD. Amibroker can program to scan the stocks for buy and sell signals.
These are script generated signals. Not all scan results are shown here. The MACD signal should use with price action. Users must understand what MACD and price action are all about before using them. If necessary you should attend a course to learn more on Technical Analysis (TA) and Moving Average Convergence Divergence, MACD.
Once again, the website does not guarantee any results or investment return based on the information and instruction you have read here. It should be used as learning aids only and if you decide to trade real money, all trading decision should be your own.