March 9, 2017
Moses Stock Trading Blog Site – AmiBrokerAcademy.com
Thank you for visiting the amibrokeracademy.com blog site. No one doing analysis like what you read here.
Let’s continue, in March 5, we saw gaps in Dow, thirty stocks all jump up (gap up), all decide the previous day price was too low. … see chart for more.
To have thirty stocks in Dow to gap up at the same time not easy. The market is really confident. We will have a closeup view to see how the market react. See the following analysis.
Welcome to Moses’s US Stock Analysis @ AmiBrokerAcademy.com.
Dow Jones Industrial Average Weekly Chart and Gaps
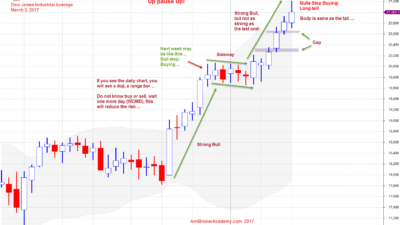
March 3, 2017 Dow Jones Industrial Average Weekly and Gaps
Dow Jones Industrial Average Daily Chart Closeup View
There is a gap of more than 100 points (on March 1), check S&P 500. S&P 500 has a gap up too. Why? You find out yourself.
If you use the strategy to only buy one tick higher strategy, you probably will miss the trade and this is good news for you. At least you were not trapped. But no right no wrong. Just trade the way you trade.
What is the lesson learned for you in the recent market trend? Interesting right. Looks like the markets are not what you to refine your trading rules. Have fun!
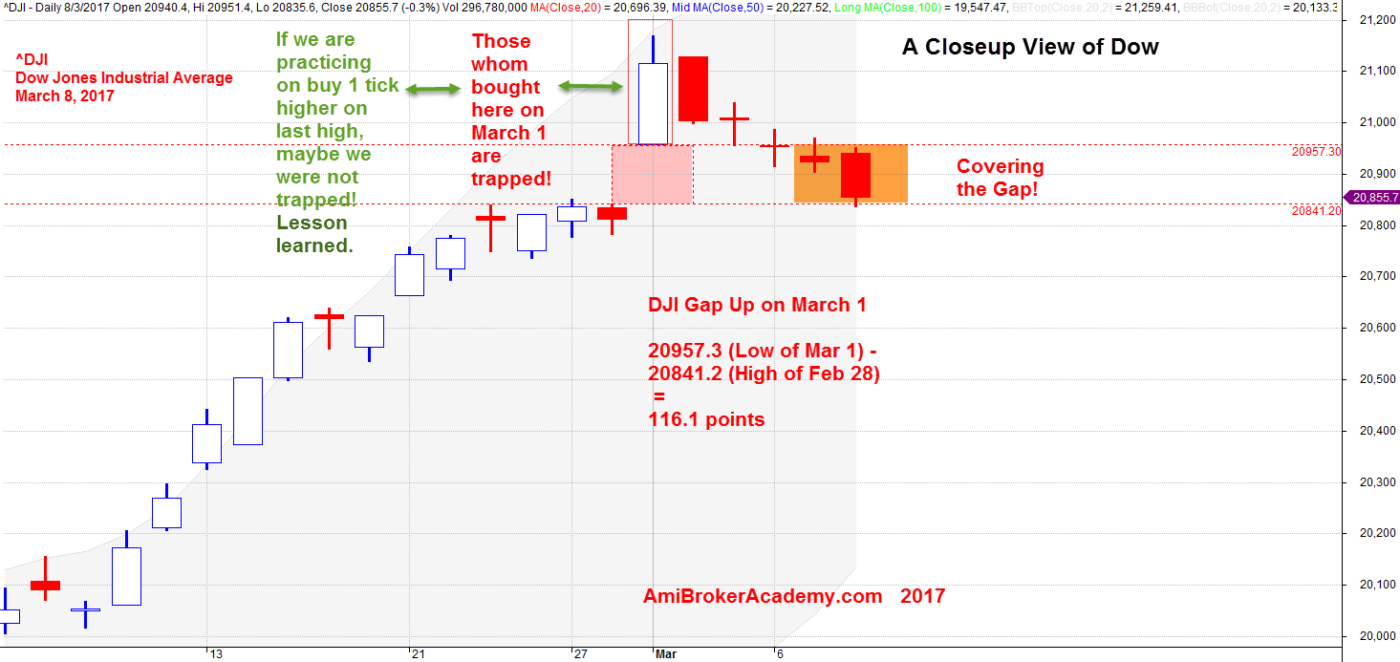
March 8, 2017 Dow Jones Industrial Average CloseupView
To have thirty stocks in Dow to gap up at the same time not easy. The market is really confident.
Remember, we are only sharing the experience and for the education purpose. We do not provide buy or sell signal, please seek your trade adviser for their expert advice. Besides that you are responsible for your own action. Trading is personal, even you can enter the trade at the exact same manner, you may not make money.
Remember too, trading is not a get rich fast business like many have advertise. It needs a lot of hard work and good money and risk management.
Have fun! Happy learning.
Moses US Stock Analysis
AmiBrokerAcademy.com
Disclaimer
The above result is for illustration purpose. It is not meant to be used for buy or sell decision. We do not recommend any particular stocks. If particular stocks of such are mentioned, they are meant as demonstration of Amibroker as a powerful charting software and MACD. Amibroker can program to scan the stocks for buy and sell signals.
These are script generated signals. Not all scan results are shown here. The MACD signal should use with price action. Users must understand what MACD and price action are all about before using them. If necessary you should attend a course to learn more on Technical Analysis (TA) and Moving Average Convergence Divergence, MACD.
Once again, the website does not guarantee any results or investment return based on the information and instruction you have read here. It should be used as learning aids only and if you decide to trade real money, all trading decision should be your own.