March 5, 2017
Moses Stock Trading Blog Site – AmiBrokerAcademy.com
Thank you for visiting the amibrokeracademy.com blog site. No one doing analysis like what you read here.
Let’s continue, in March 27, we saw gaps in Dow, thirty stocks all jump up (gap up), all decide the price is too low. … see
Welcome to Moses’s US Stock Analysis @ AmiBrokerAcademy.com.
Gaps, stock gap is when the market think that the current price is too low, the gap up price is the right price. Vise verse, when the last market price is too high, the opening price will open lower, gap down. For thirty stocks all gap up at the same time, and resulting in the Dow to gap is rare. See chart for more.
Picture worth a thousand words.
Dow Jones Industrial Average Weekly Chart and Gaps
Picture worth a thousand words, you can spot the trend, the bull trend. The trend has up pause up, UPU.
For pattern recognition, this is a bull flag.
After gaps, two gaps in the weekly chart, the bull stop buying, from the long tail. Many bulls begin to take profits. Bears are joining in selling too. You will see clear bear bar in the daily chart. See chart for details.
If you look back (look left), just in the recent trades, when the bull stop buying, the trend goes sideways. Now you see the last bar, the tail is the same as the body. It signals the bears are ready. When not sure, it is okay to wait one more day.
Watch out for the trend reversal.
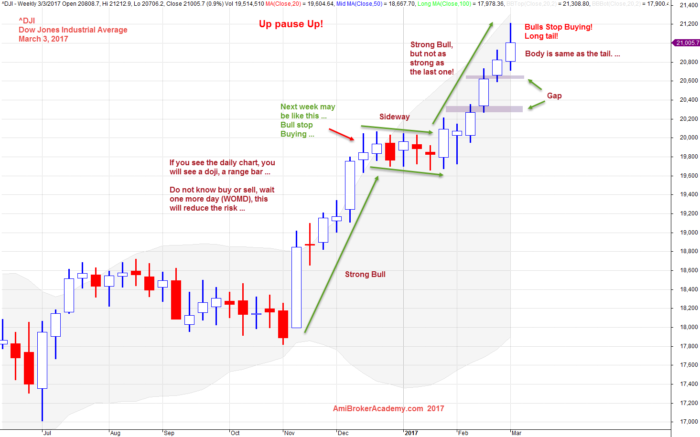
March 3, 2017 Dow Jones Industrial Average Weekly and Gaps
Dow Jones Industrial Average Daily Chart and Gaps
To have thirty stocks in Dow to gap up at the same time not easy. The market is really confident.
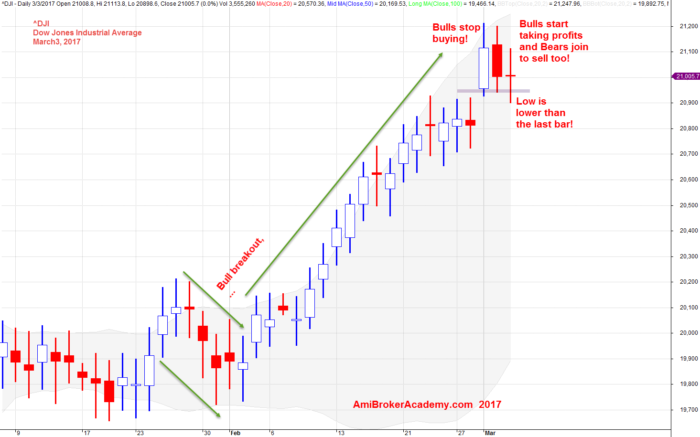
March 3, 2017 Dow Jones Industrial Average Daily and Gaps
Remember, we are only sharing the experience and for the education purpose. We do not provide buy or sell signal, please seek your trade adviser for their expert advice. Besides that you are responsible for your own action. Trading is personal, even you can enter the trade at the exact same manner, you may not make money.
Remember too, trading is not a get rich fast business like many have advertise. It needs a lot of hard work and good money and risk management.
Have fun! Happy learning.
Moses US Stock Analysis
AmiBrokerAcademy.com
Disclaimer
The above result is for illustration purpose. It is not meant to be used for buy or sell decision. We do not recommend any particular stocks. If particular stocks of such are mentioned, they are meant as demonstration of Amibroker as a powerful charting software and MACD. Amibroker can program to scan the stocks for buy and sell signals.
These are script generated signals. Not all scan results are shown here. The MACD signal should use with price action. Users must understand what MACD and price action are all about before using them. If necessary you should attend a course to learn more on Technical Analysis (TA) and Moving Average Convergence Divergence, MACD.
Once again, the website does not guarantee any results or investment return based on the information and instruction you have read here. It should be used as learning aids only and if you decide to trade real money, all trading decision should be your own.