November 30, 2017
Singapore Stock Analysis
BS6 YingZiJiang Shipbuilding and Support Resistance
See chart, YingZiJiang Ship Building after the stock price touch the 1.70 the market start to wondering the value of the share price.
The stock price start to retrace lower, in fact much lower than the last resistance. This make all that whom bought the stock get trapped. In fact if you are pattern trader, you may be become very alert, as this is an ABCD sell pattern.
Pattern is a good way to plan your trade.
Powerful Chart Software – AmiBroker
The following chart is produced using AmiBroker charting software. It is a powerful chart software. You can easily add the channel. See chart.
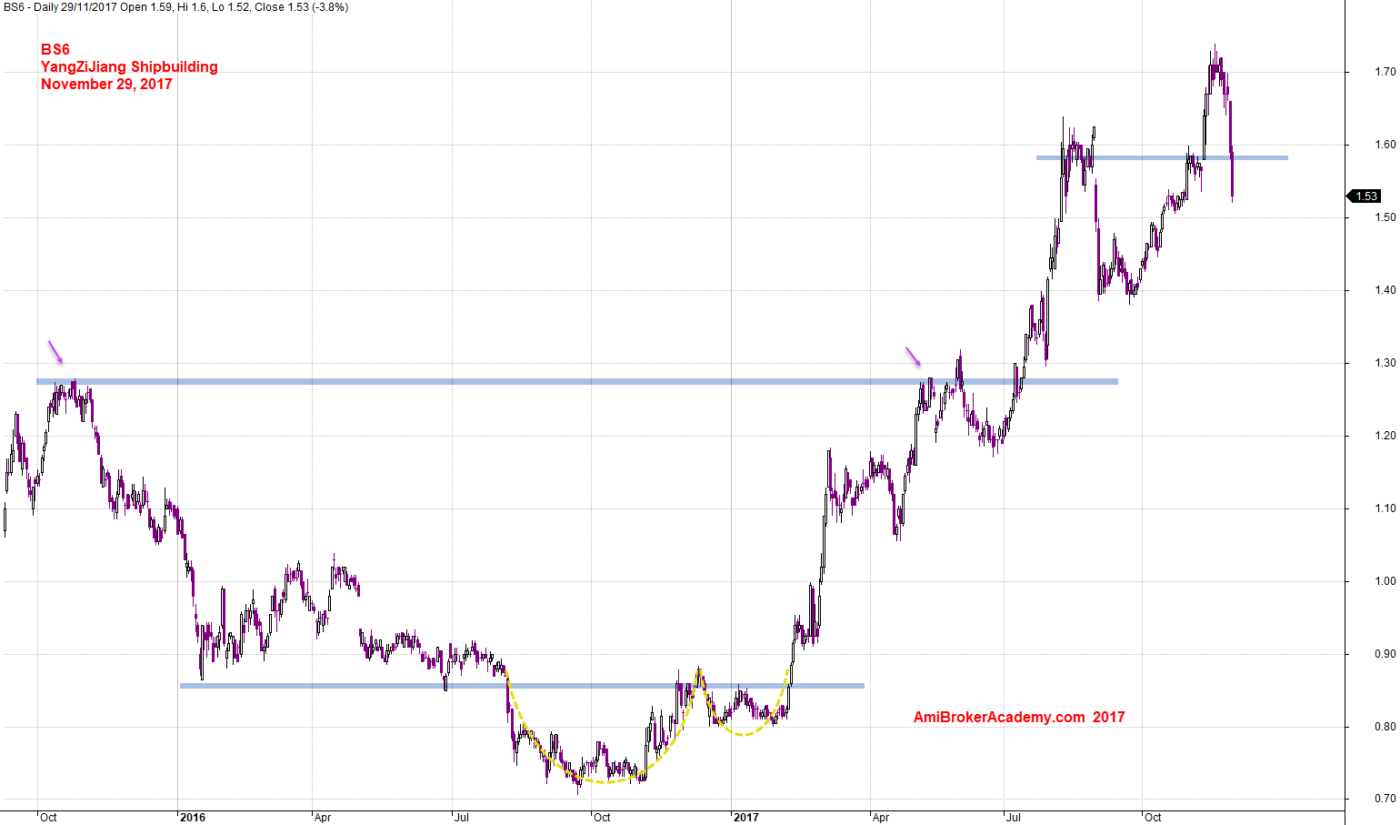
November 29, 2017 YangZiJiang Shipbuilding and Support Resistance
Moses
AmiBrokerAcademy.com
Disclaimer
The above result is for illustration purpose. It is not meant to be used for buy or sell decision. We do not recommend any particular stocks. If particular stocks of such are mentioned, they are meant as demonstration of Amibroker as a powerful charting software and MACD. Amibroker can program to scan the stocks for buy and sell signals.
These are script generated signals. Not all scan results are shown here. The MACD signal should use with price action. Users must understand what MACD and price action are all about before using them. If necessary you should attend a course to learn more on Technical Analysis (TA) and Moving Average Convergence Divergence, MACD.
Once again, the website does not guarantee any results or investment return based on the information and instruction you have read here. It should be used as learning aids only and if you decide to trade real money, all trading decision should be your own.