April 26, 2017
^GSPC S&P 500 Indexand 34 EMA Wave
The index is crossing below 34 EMA Wave. But on Friday, there was a turning point. The S&P 500 gaps up, retested the recent high.
See the Support Resistance.
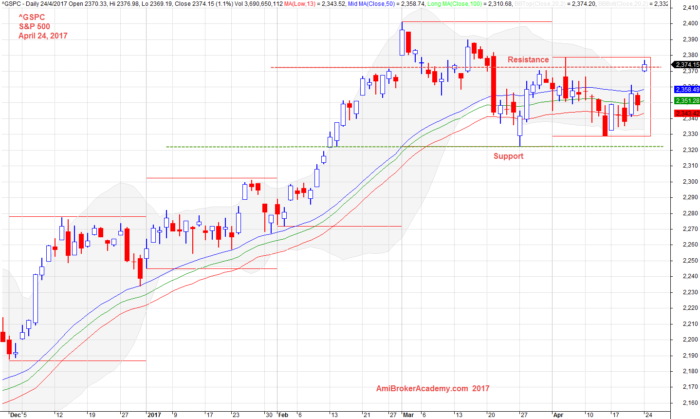
April 24, 2017 S&P 500 and 34 EMA Band
^GSPC S&P 500 Index and Channel
Picture worth a thousand words, see how we draw a channel, connecting the high and copy and paste the parallel line at the low.
We see the peaks keep touching the upper line, trendline.
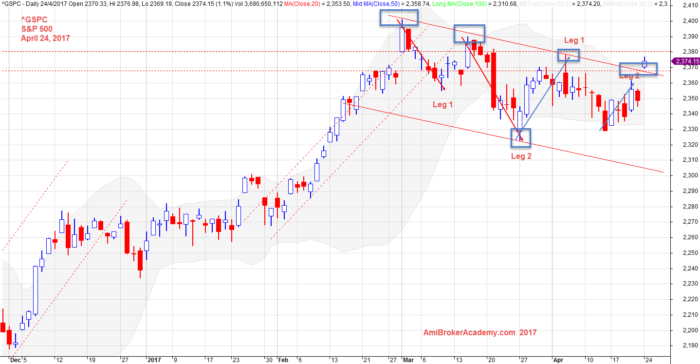
April 24, 2017 S&P 500 and Channel
^GSPC S&P 500 Index and MACD Indicator
What have you got from MACD indicator?
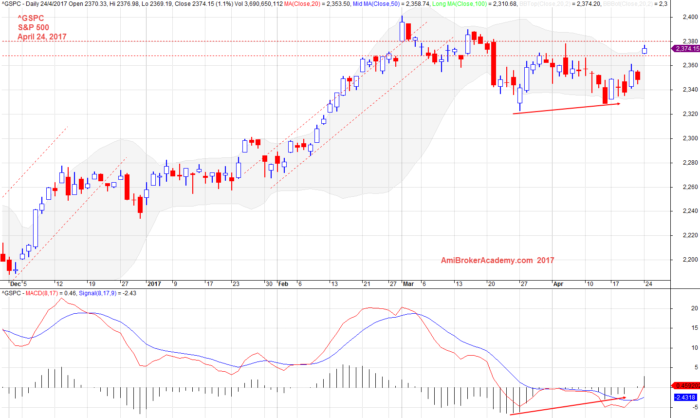
April 24, 2017 S&P 500 and MACD Divergence
Moses Stock Analysis
AmiBrokerAcademy.com
Disclaimer
The above result is for illustration purpose. It is not meant to be used for buy or sell decision. We do not recommend any particular stocks. If particular stocks of such are mentioned, they are meant as demonstration of Amibroker as a powerful charting software and MACD. Amibroker can program to scan the stocks for buy and sell signals.
These are script generated signals. Not all scan results are shown here. The MACD signal should use with price action. Users must understand what MACD and price action are all about before using them. If necessary you should attend a course to learn more on Technical Analysis (TA) and Moving Average Convergence Divergence, MACD.
Once again, the website does not guarantee any results or investment return based on the information and instruction you have read here. It should be used as learning aids only and if you decide to trade real money, all trading decision should be your own.