February 18, 2018
This Year is Extra Hot and Spicy
See the illustration below using Apple Inc stock price. Read through all the charts, and only the experience traders could really appreciate why.
US Stock Analysis
Apple Inc and Fibonacci Retracement
See chart for more, swing low from March Low or June Low does not make a different if you understand what I mean from comments on the chart.
If you do not understand how to trade, and likely you still get stop out. So, the key word is always wait and enter at the right time. Why? Read all the charts on this post, as an experience traders you will understand all.
Manage your risk!
Powerful Chart Software – AmiBroker
The following chart is produced using AmiBroker charting software. It is a powerful chart software. You plot the stocks you are interested all in one chart, as long as you still could read them. See chart below.
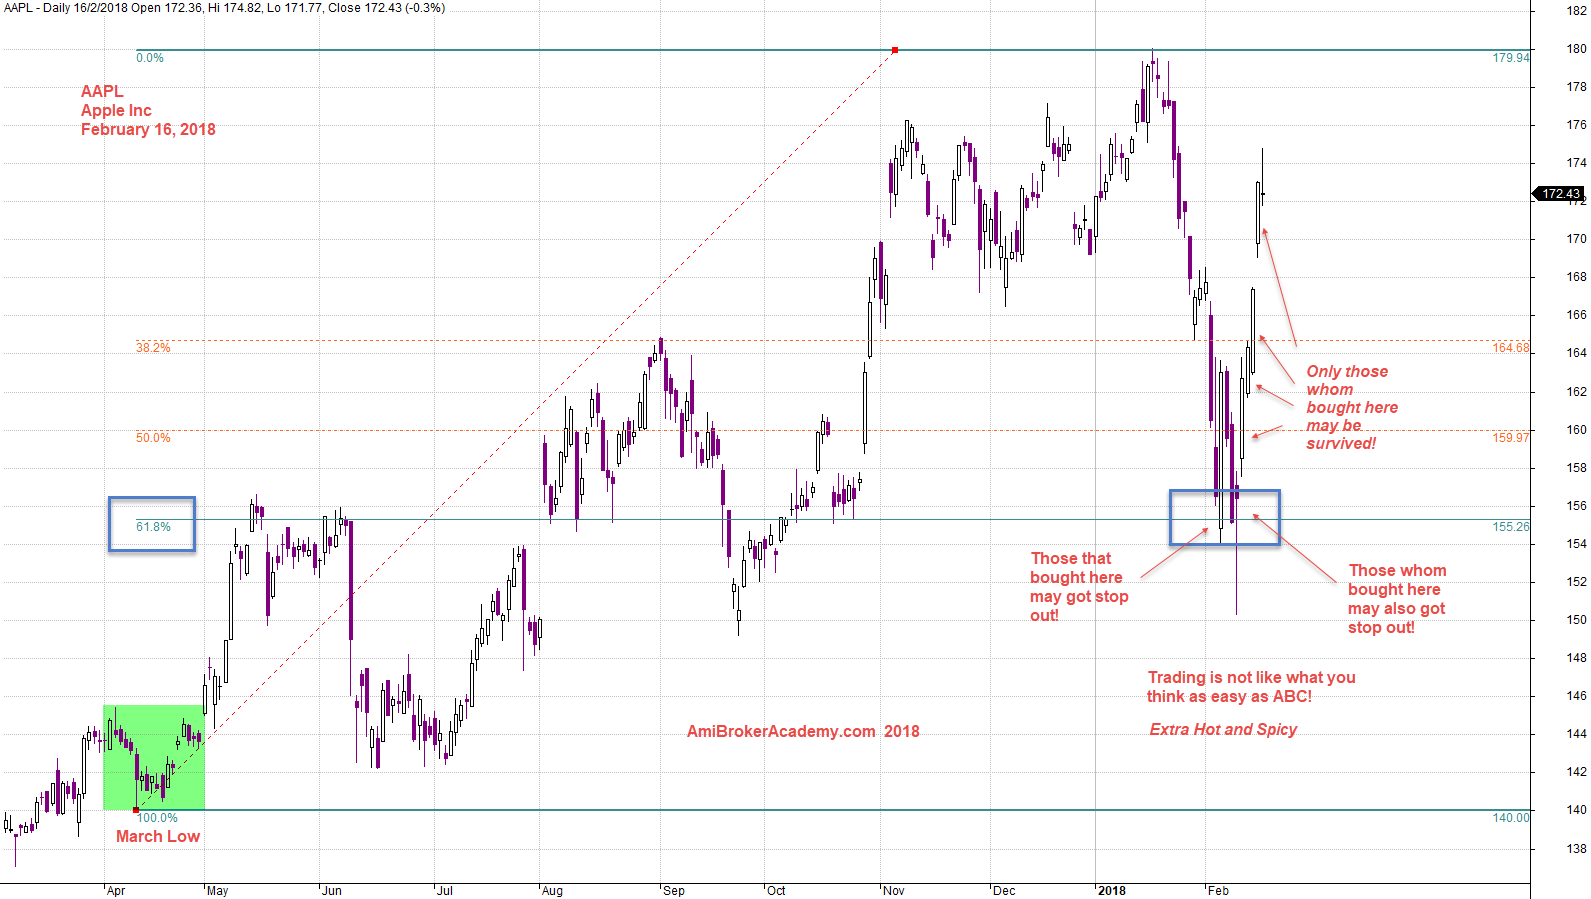
20180216 Apple Inc and March Low Fibonacci Retracement
Apple Inc and Fibonacci Retracement Swing Low from June Low
See chart for more.
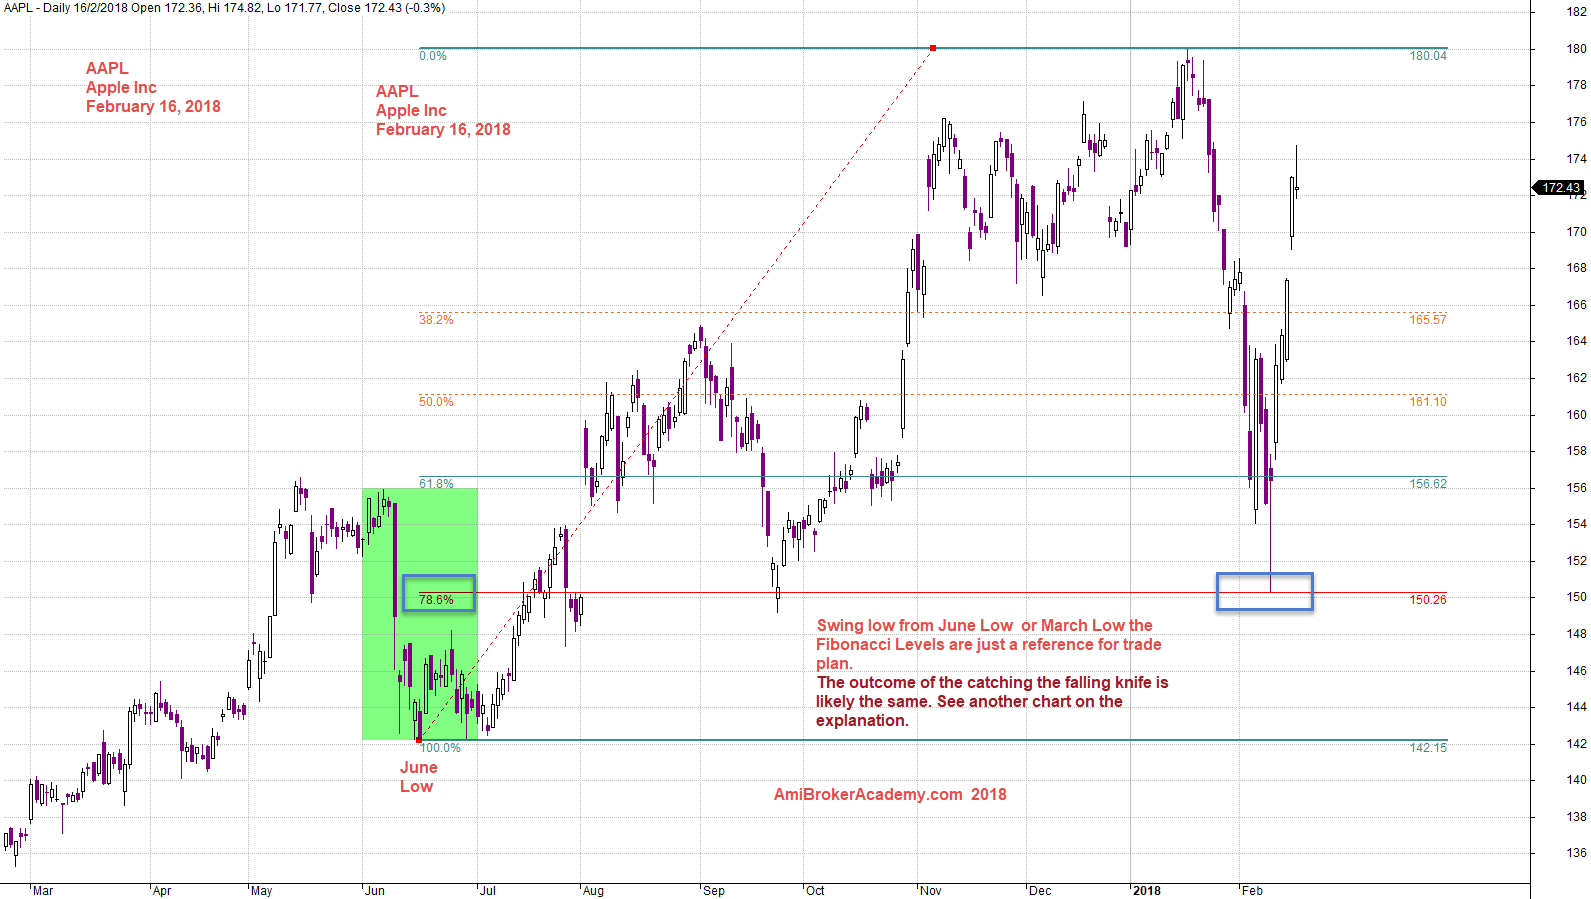
20180216 Apple Inc and June Low Fibonacci Retracement
Apple Inc and MA Band
See chart for more. Some tool gives you the trend.
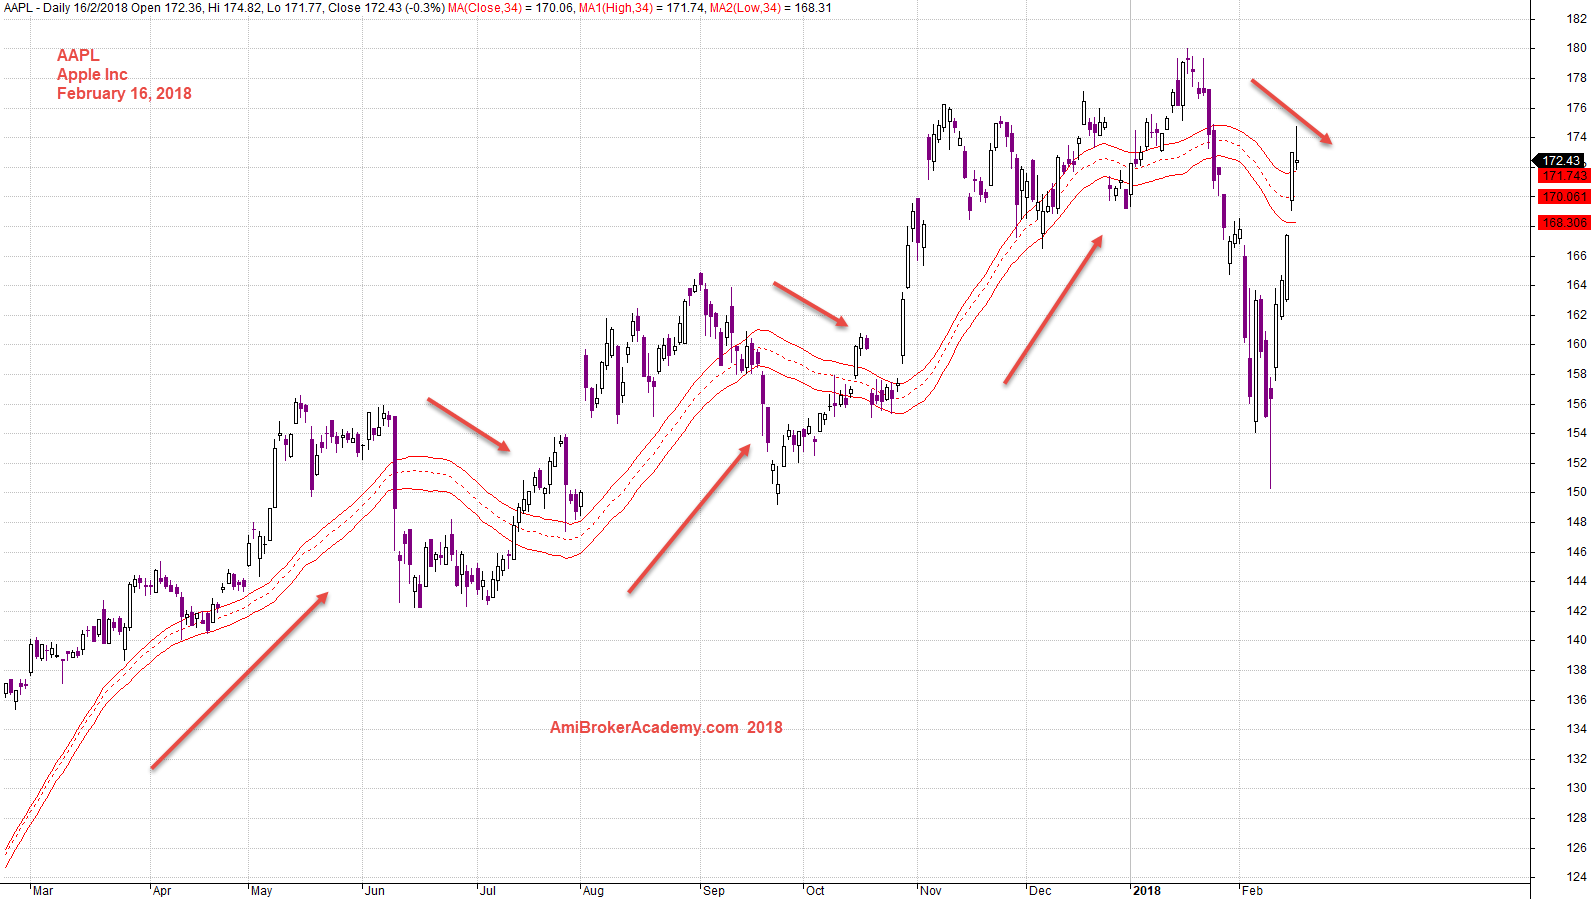
February 16, 2018 Apple Inc and MA Band
Apple Inc and MACD Signals
This probably the most important chart for this posting. It explains all for how you could avoid the stop out. Of course, many may not understand and agree. Be it.
Have fun learning!
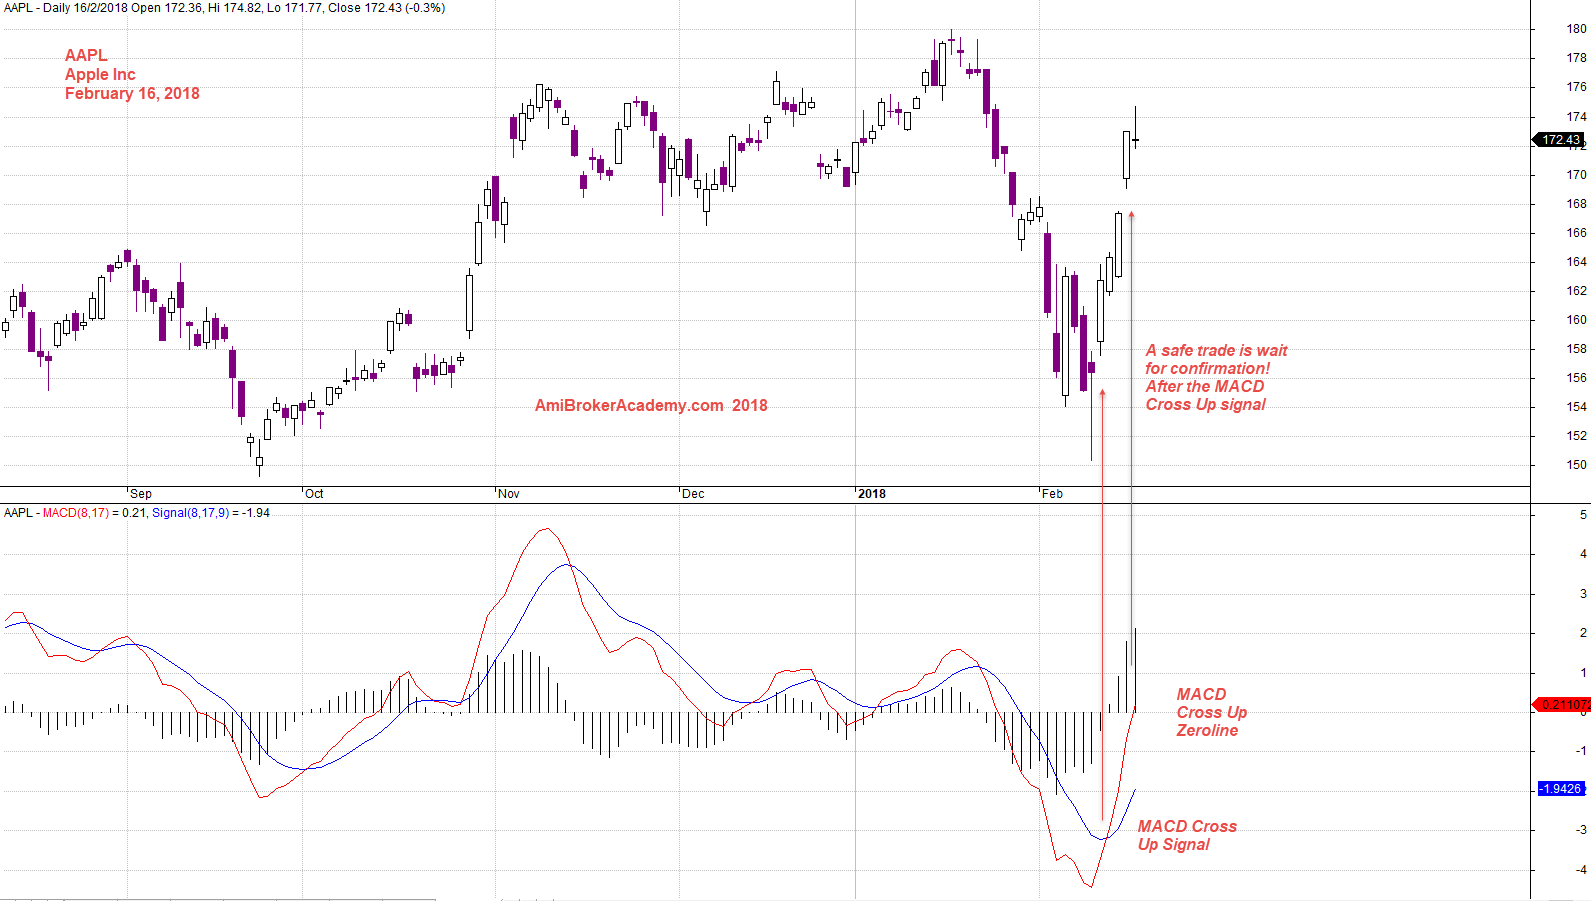
February 16, 2018 Apple Inc and MACD as Confirmation for Entry
Moses
AmiBrokerAcademy.com
Disclaimer
The above result is for illustration purpose. It is not meant to be used for buy or sell decision. We do not recommend any particular stocks. If particular stocks of such are mentioned, they are meant as demonstration of Amibroker as a powerful charting software and MACD. Amibroker can program to scan the stocks for buy and sell signals.
These are script generated signals. Not all scan results are shown here. The MACD signal should use with price action. Users must understand what MACD and price action are all about before using them. If necessary you should attend a course to learn more on Technical Analysis (TA) and Moving Average Convergence Divergence, MACD.
Once again, the website does not guarantee any results or investment return based on the information and instruction you have read here. It should be used as learning aids only and if you decide to trade real money, all trading decision should be your own.