November 2, 2017
1B0 MM2 Asia and 34 MA Band
See chart for more. Price action bouncing above 34 MA Band, closed below 34 MA Band, crossed above again and finally supported by 34 MA Band. Price action has tested 84 cents high and 41 cents low. Market has regain the confident and begin to buy up the stock price. Will see.
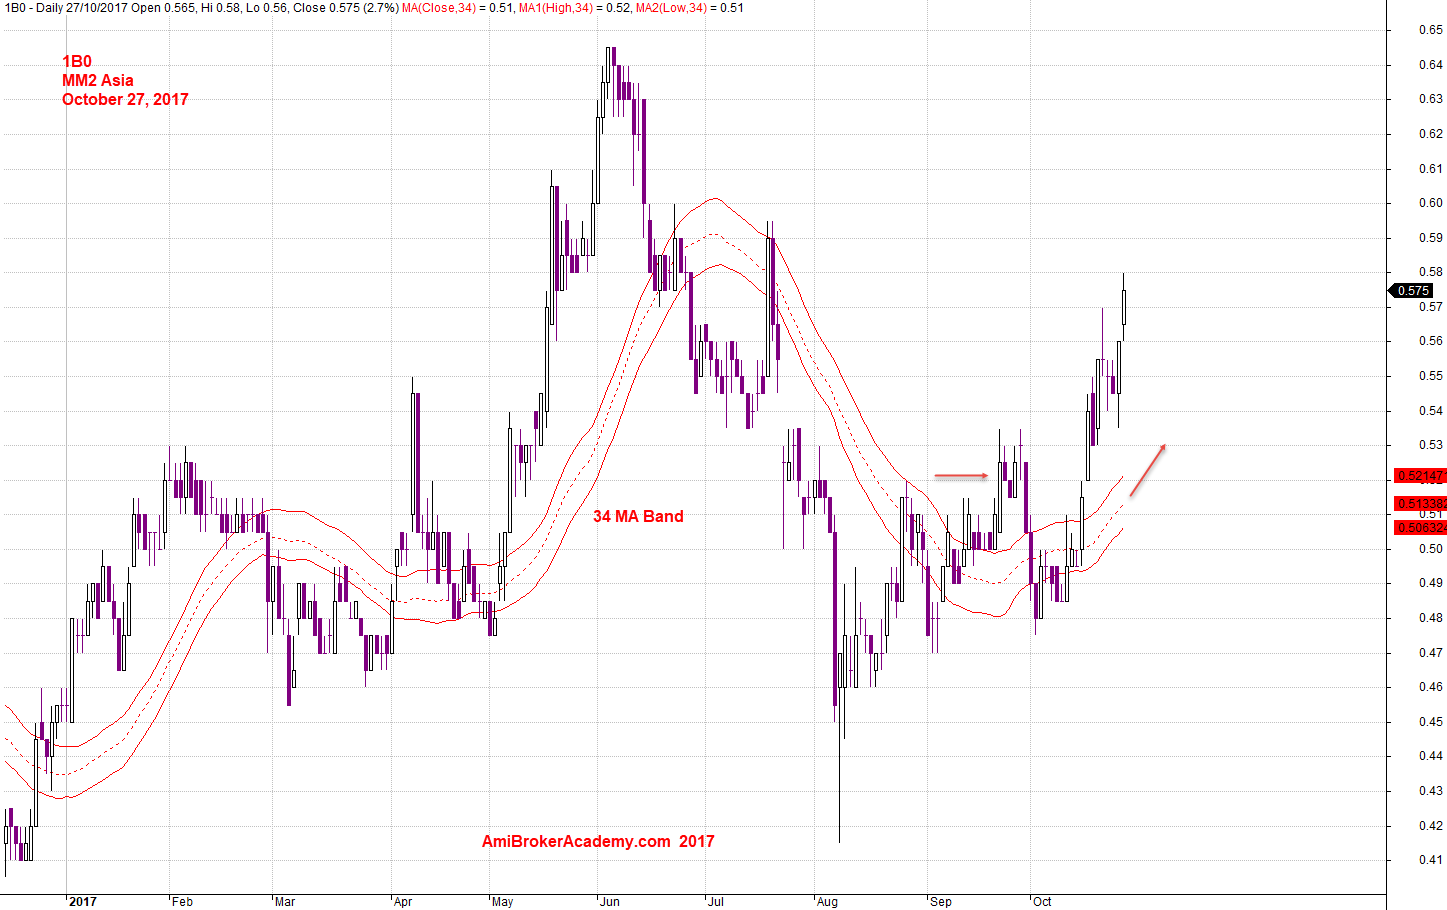
October 27, 2017 MM2 Asia and 34 MA Band
1B0 MM2 Asia and Support Resistance Level
See chart for more.
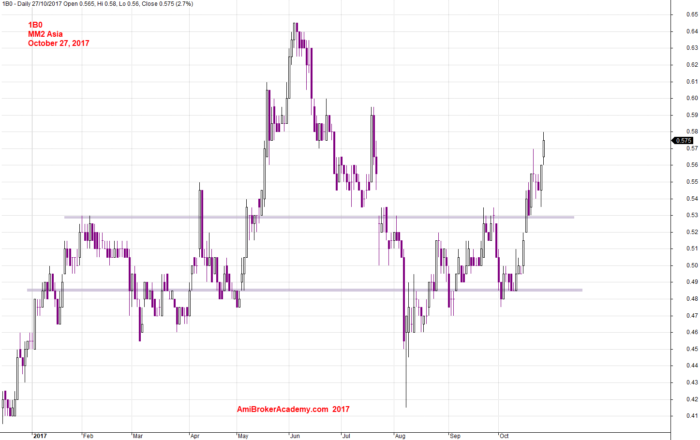
October 27, 2017 MM2 Asia and Support Resistance
1B0 MM1 Asia and MACD Breakout Strategy
See chart for more.
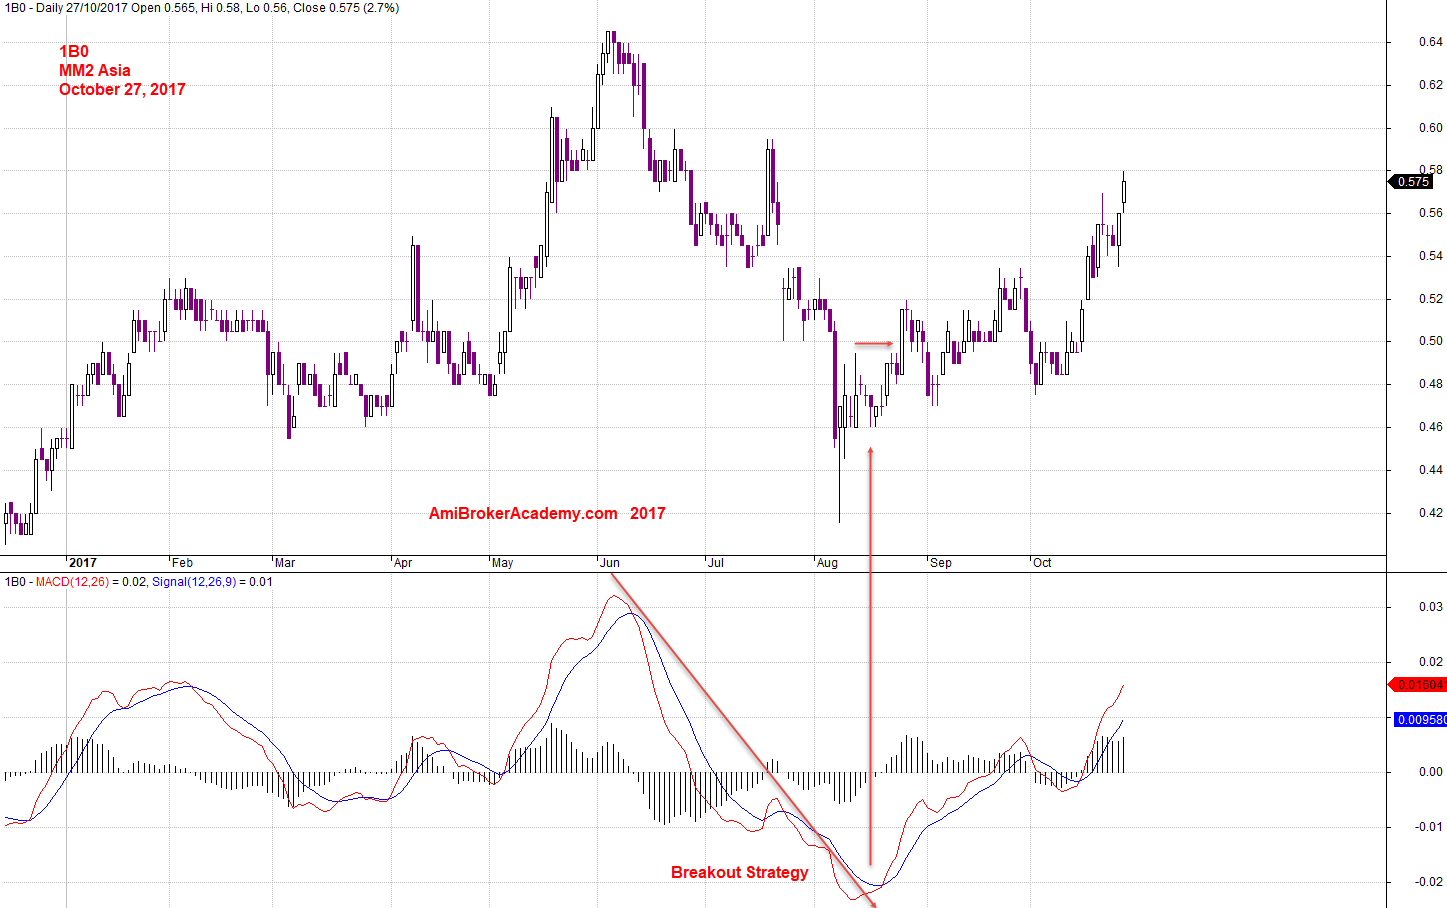
October 27, 2017 MM2 Asia and MACD Breakout Strategy
Moses
AmiBrokerAcademy.com
Disclaimer
The above result is for illustration purpose. It is not meant to be used for buy or sell decision. We do not recommend any particular stocks. If particular stocks of such are mentioned, they are meant as demonstration of Amibroker as a powerful charting software and MACD. Amibroker can program to scan the stocks for buy and sell signals.
These are script generated signals. Not all scan results are shown here. The MACD signal should use with price action. Users must understand what MACD and price action are all about before using them. If necessary you should attend a course to learn more on Technical Analysis (TA) and Moving Average Convergence Divergence, MACD.
Once again, the website does not guarantee any results or investment return based on the information and instruction you have read here. It should be used as learning aids only and if you decide to trade real money, all trading decision should be your own.