Welcome to AmiBroker Academy dot com, amibrokeracademy.com.
If There is Only One Chart This is It
This is not a site that provides buy or sell signals directly. We read the stock chart bar by bar. If you understand what we read, you will get the buy or sell idea. Have fun!
Buy or Sell, you decide
Trading is very simple yet very difficult. Price is either up or down. But catch the right move is not easy. I believe many must have missed the falling knife. Now, many will be watching the topping. Can any catch the topping? Will see.
Up Down or Sideways
Trading is all probability. The price action is either up, down or sideways.
Trade what you see. Manage your risk.
Our Believe – Buy Support Sell Resistance.
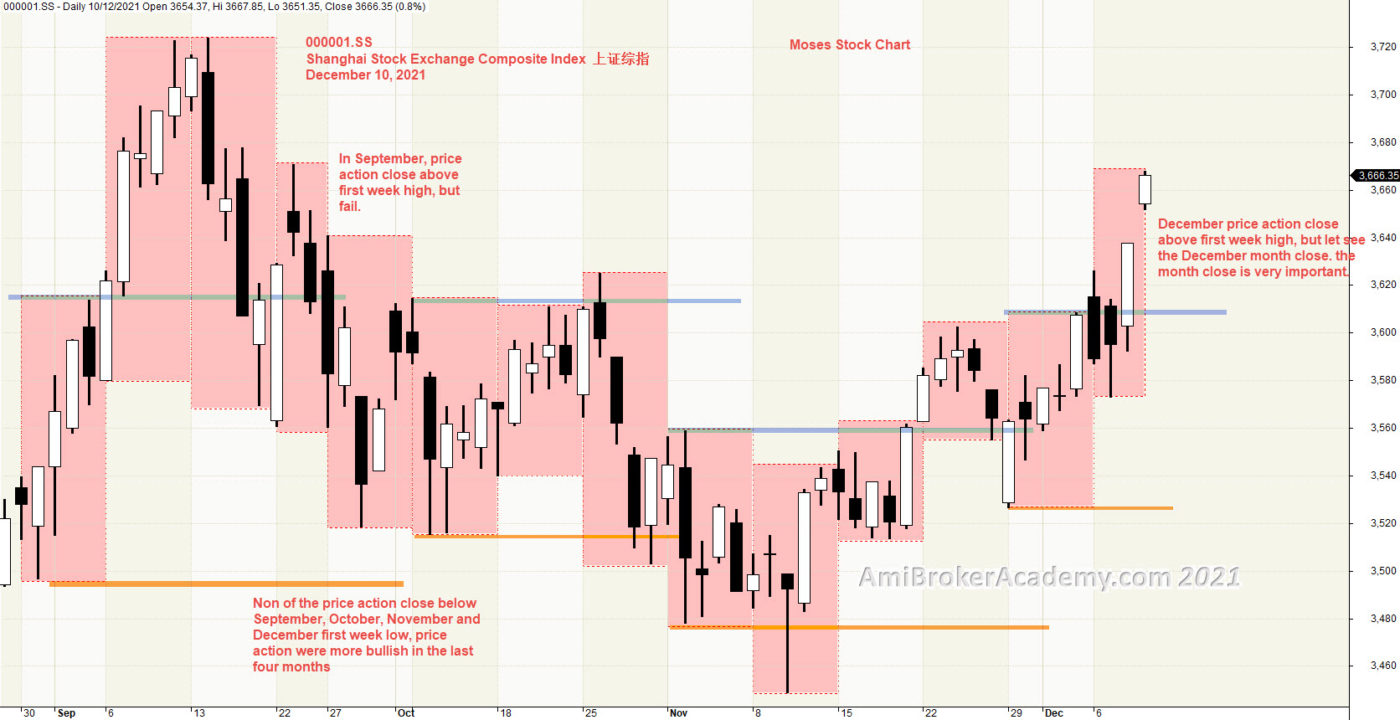
1) 000001.SS Shanghai Stock Exchange Composite Index 上证综指 Week High Low
Picture worth a thousand words. Price Action breakout and close above the first week high on September, but fail thereafter. Price Action pullback to near the first week low later. On the following month, October, price action almost within the September first week. In November, price action begin to close above the November first week high. And continue to go higher on December. We have to wait to month close before we know the trend is above or below the December first high or low.
See chart. We plan to do a month week high low to understand the index better.
If you are a buy and hold strategist, Will you sell now or buy now? Remember only buy near support, and sell near resistance. Wait for the price action draw near either resistance or support.
From the chart, price action is now near the resistance zone.
20211210 Shanghai Stock Exchange Composite Index 上证综指 Week High Low
Moses Power Charting
Official AmiBrokerAcademy.com Charting
Disclaimer
The above result is for illustration purpose. It is meant to be used for learning buy or sell signals. We do not recommend for any particular stocks. If particular stocks of such are mentioned, they are meant as a demonstration of Amibroker as a powerful charting software. Amibroker is a charting software, it can program to scan the stocks for buy and sell signals. Or backtest for any trading strategy or technique.
We post script generated signals. Not all scan results are shown here depending on selection criterial. The MACD signal should use with price action. Users must understand what MACD and price action are all about before using them. If necessary you should attend a course to learn more on Technical Analysis (TA) and Moving Average Convergence Divergence, MACD.
Once again, the website does not guarantee any results or investment return based on the information and instruction you have read here. It should be used as learning aids only and if you decide to trade real money, all trading decision should be your own.
We learn from many past and present great traders. Kudo to these master.
Welcome to AmiBroker Academy dot com, amibrokeracademy.com.
If There is Only One Chart This is It
This is not a site that provides buy or sell signals directly. We read the stock chart bar by bar. If you understand what we read, you will get the buy or sell idea. Have fun!
Buy or Sell, you decide
Trading is very simple yet very difficult. Price is either up or down. But catch the right move is not easy. I believe many must have missed the falling knife. Now, many will be watching the topping. Can any catch the topping? Will see.
Up Down or Sideways
Trading is all probability. The price action is either up, down or sideways.
Trade what you see. Manage your risk.
Our Believe – Buy Support Sell Resistance.
1) Frencken Group Limited Week High Low
Picture worth a thousand words. Benchmark the following chart with the box chart of week high low. You will find that the price action of each bar is a box of the weekly high low.
See chart. The Zoom out of the daily chart. What is your perspective now.
If you are a buy and hold strategist, Will you sell now or buy now? Remember only buy near support, and sell near resistance. Wait for the price action draw near either resistance or support.
From the chart, price action is now near the resistance zone.
Moses Power Charting
Official AmiBrokerAcademy.com Charting
Disclaimer
The above result is for illustration purpose. It is meant to be used for learning buy or sell signals. We do not recommend for any particular stocks. If particular stocks of such are mentioned, they are meant as a demonstration of Amibroker as a powerful charting software. Amibroker is a charting software, it can program to scan the stocks for buy and sell signals. Or backtest for any trading strategy or technique.
We post script generated signals. Not all scan results are shown here depending on selection criterial. The MACD signal should use with price action. Users must understand what MACD and price action are all about before using them. If necessary you should attend a course to learn more on Technical Analysis (TA) and Moving Average Convergence Divergence, MACD.
Once again, the website does not guarantee any results or investment return based on the information and instruction you have read here. It should be used as learning aids only and if you decide to trade real money, all trading decision should be your own.
We learn from many past and present great traders. Kudo to these master.
Welcome to AmiBroker Academy dot com, amibrokeracademy.com.
If There is Only One Chart This is It
This is not a site that provides buy or sell signals directly. We read the stock chart bar by bar. If you understand what we read, you will get the buy or sell idea. Have fun!
Buy or Sell, you decide
Trading is very simple yet very difficult. Price is either up or down. But catch the right move is not easy. I believe many must have missed the falling knife. Now, many will be watching the topping. Can any catch the topping? Will see.
Up Down or Sideways
Trading is all probability. The price action is either up, down or sideways.
Trade what you see. Manage your risk.
Our Believe – Buy Support Sell Resistance.
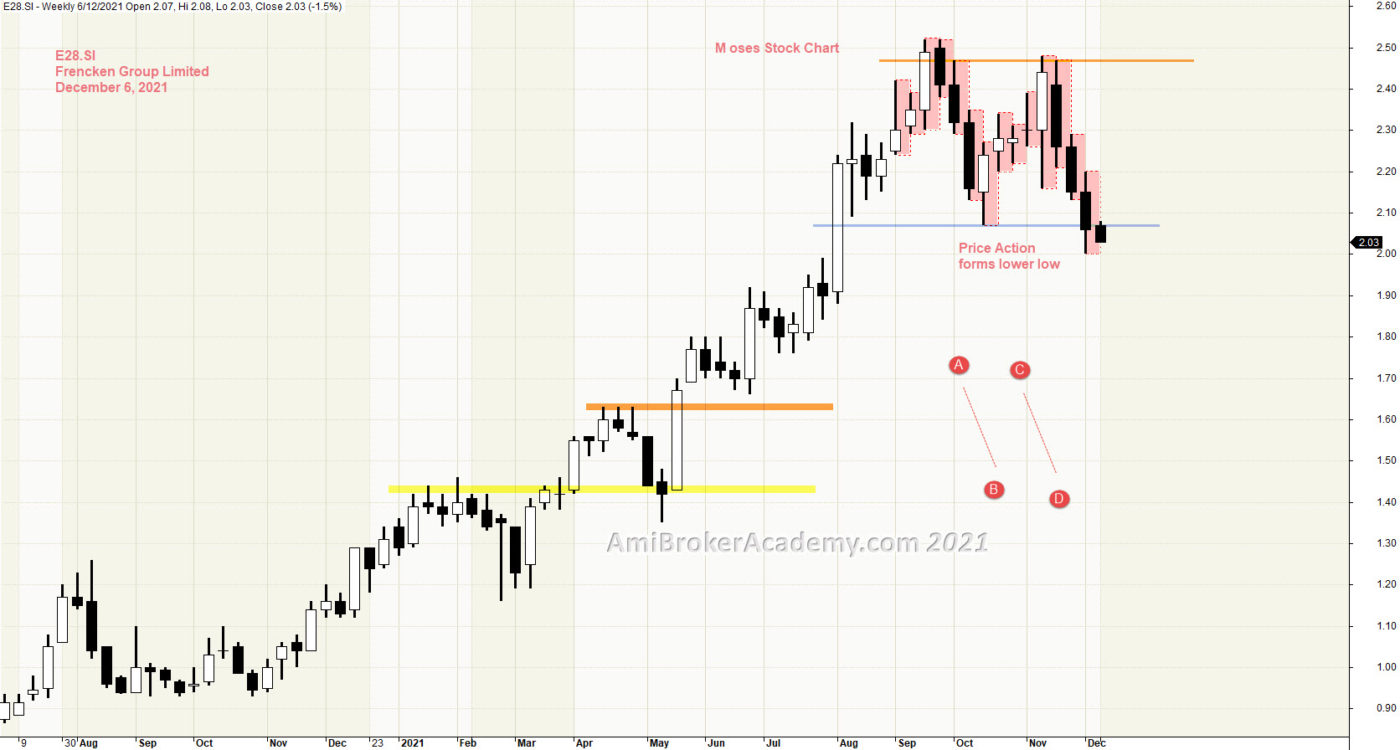
1) Frencken Group Limited Week High Low
Picture worth a thousand words. Price Action did not breakout below September first week low but on the next month. Price Action close above September first week high and fail. Price Action on the next month, have the similar pattern. Price Action instead on close below, this time price action close above and fail. So, trading is very lifely, it is not fixed.
See chart. We will show you a weekly chart. Each bar of the weekly chart is a box of the daily chart. Have fun!
If you are a buy and hold strategist, Will you sell now or buy now? Remember only buy near support, and sell near resistance. Wait for the price action draw near either resistance or support.
From the chart, price action is now near the resistance zone.
20211206 Frencken Group Limited Week High Low
Moses Power Charting
Official AmiBrokerAcademy.com Charting
Disclaimer
The above result is for illustration purpose. It is meant to be used for learning buy or sell signals. We do not recommend for any particular stocks. If particular stocks of such are mentioned, they are meant as a demonstration of Amibroker as a powerful charting software. Amibroker is a charting software, it can program to scan the stocks for buy and sell signals. Or backtest for any trading strategy or technique.
We post script generated signals. Not all scan results are shown here depending on selection criterial. The MACD signal should use with price action. Users must understand what MACD and price action are all about before using them. If necessary you should attend a course to learn more on Technical Analysis (TA) and Moving Average Convergence Divergence, MACD.
Once again, the website does not guarantee any results or investment return based on the information and instruction you have read here. It should be used as learning aids only and if you decide to trade real money, all trading decision should be your own.
We learn from many past and present great traders. Kudo to these master.
Welcome to AmiBroker Academy dot com, amibrokeracademy.com.
If There is Only One Chart This is It
This is not a site that provides buy or sell signals directly. We read the stock chart bar by bar. If you understand what we read, you will get the buy or sell idea. Have fun!
Buy or Sell, you decide
Trading is very simple yet very difficult. Price is either up or down. But catch the right move is not easy. I believe many must have missed the falling knife. Now, many will be watching the topping. Can any catch the topping? Will see.
Up Down or Sideways
Trading is all probability. The price action is either up, down or sideways.
Trade what you see. Manage your risk.
Our Believe – Buy Support Sell Resistance.
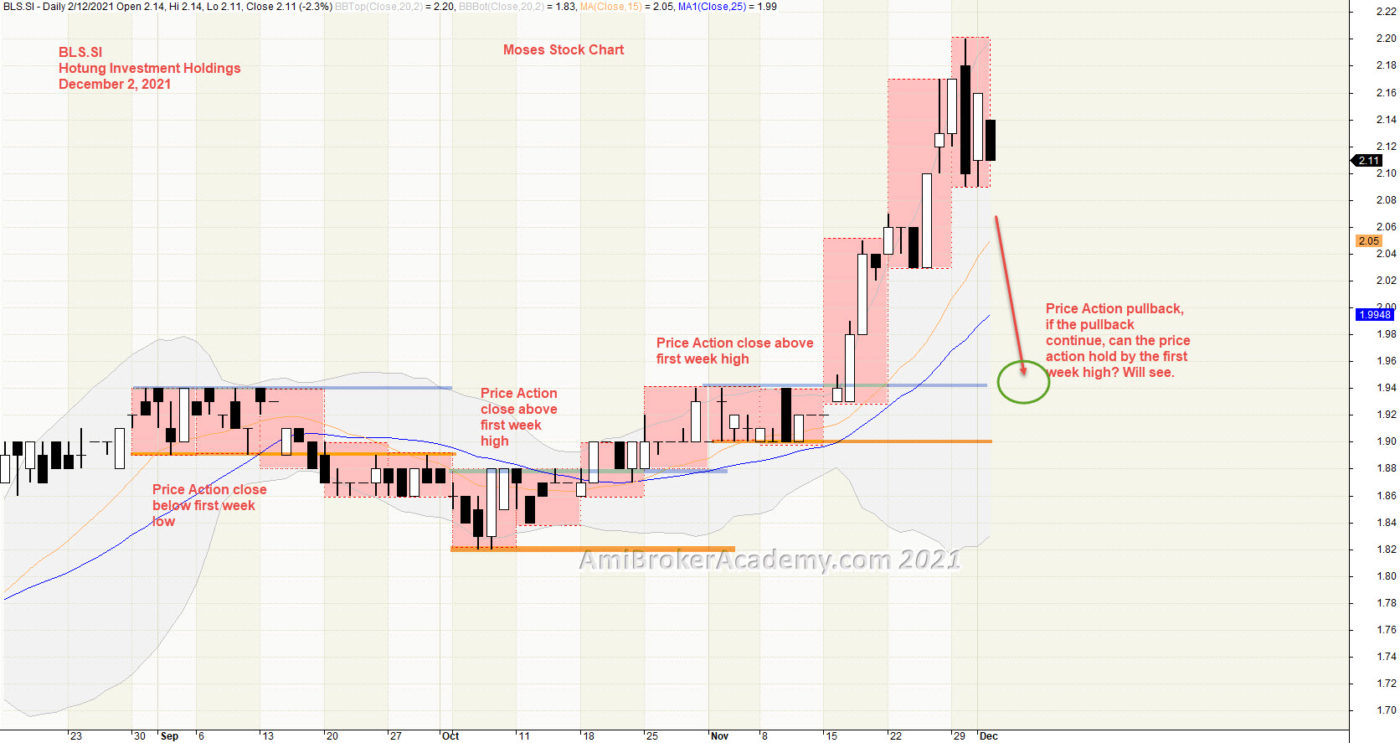
1) Hotung Investment Holdings and week High Low
Picture worth a thousand words. Price Action breakout below September first week low and reversal. Price Action continues to go higher after October first week high. And price action does not stop there, price action continues to go higher. Now, see chart, we begin to see the price action become weaken. Can price action fall? If so, can the November first week high hold the fall, in other words support the the price action.
See chart. We posted a big picture, check it out.
If you are a buy and hold strategist, Will you sell now or buy now? Remember only buy near support, and sell near resistance. Wait for the price action draw near either resistance or support.
From the chart, price action is now near the resistance zone.
20211202 Hotung Investment Holdings and week High Low
Moses Power Charting
Official AmiBrokerAcademy.com Charting
Disclaimer
The above result is for illustration purpose. It is meant to be used for learning buy or sell signals. We do not recommend for any particular stocks. If particular stocks of such are mentioned, they are meant as a demonstration of Amibroker as a powerful charting software. Amibroker is a charting software, it can program to scan the stocks for buy and sell signals. Or backtest for any trading strategy or technique.
We post script generated signals. Not all scan results are shown here depending on selection criterial. The MACD signal should use with price action. Users must understand what MACD and price action are all about before using them. If necessary you should attend a course to learn more on Technical Analysis (TA) and Moving Average Convergence Divergence, MACD.
Once again, the website does not guarantee any results or investment return based on the information and instruction you have read here. It should be used as learning aids only and if you decide to trade real money, all trading decision should be your own.
We learn from many past and present great traders. Kudo to these master.
Welcome to AmiBroker Academy dot com, amibrokeracademy.com.
If There is Only One Chart This is It
This is not a site that provides buy or sell signals directly. We read the stock chart bar by bar. If you understand what we read, you will get the buy or sell idea. Have fun!
Buy or Sell, you decide
Trading is very simple yet very difficult. Price is either up or down. But catch the right move is not easy. I believe many must have missed the falling knife. Now, many will be watching the topping. Can any catch the topping? Will see.
Up Down or Sideways
Trading is all probability. The price action is either up, down or sideways.
Trade what you see. Manage your risk.
Our Believe – Buy Support Sell Resistance.
1) BLS Hotung Investment Holdings and Moving Averages
Picture worth a thousand words. Zoom out and see a bigger picture. Price Action moves in a zigzag manner to break the resistance and goes higher. Price Action continues to form higher high, and higher low. Price Action has got a sharp peak.
We did a zoom in analysis, please check it out.
See chart.
20211202 Hotung Investment Holdings and Moving Averages
Moses Power Charting
Official AmiBrokerAcademy.com Charting
Disclaimer
The above result is for illustration purpose. It is meant to be used for learning buy or sell signals. We do not recommend for any particular stocks. If particular stocks of such are mentioned, they are meant as a demonstration of Amibroker as a powerful charting software. Amibroker is a charting software, it can program to scan the stocks for buy and sell signals. Or backtest for any trading strategy or technique.
We post script generated signals. Not all scan results are shown here depending on selection criterial. The MACD signal should use with price action. Users must understand what MACD and price action are all about before using them. If necessary you should attend a course to learn more on Technical Analysis (TA) and Moving Average Convergence Divergence, MACD.
Once again, the website does not guarantee any results or investment return based on the information and instruction you have read here. It should be used as learning aids only and if you decide to trade real money, all trading decision should be your own.
We learn from many past and present great traders. Kudo to these master.
Welcome to AmiBroker Academy dot com, amibrokeracademy.com.
If There is Only One Chart This is It
This is not a site that provides buy or sell signals directly. We read the stock chart bar by bar. If you understand what we read, you will get the buy or sell idea. Have fun!
Buy or Sell, you decide
Trading is very simple yet very difficult. Price is either up or down. But catch the right move is not easy. I believe many must have missed the falling knife. Now, many will be watching the topping. Can any catch the topping? Will see.
Up Down or Sideways
Trading is all probability. The price action is either up, down or sideways.
Trade what you see. Manage your risk.
Our Believe – Buy Support Sell Resistance.
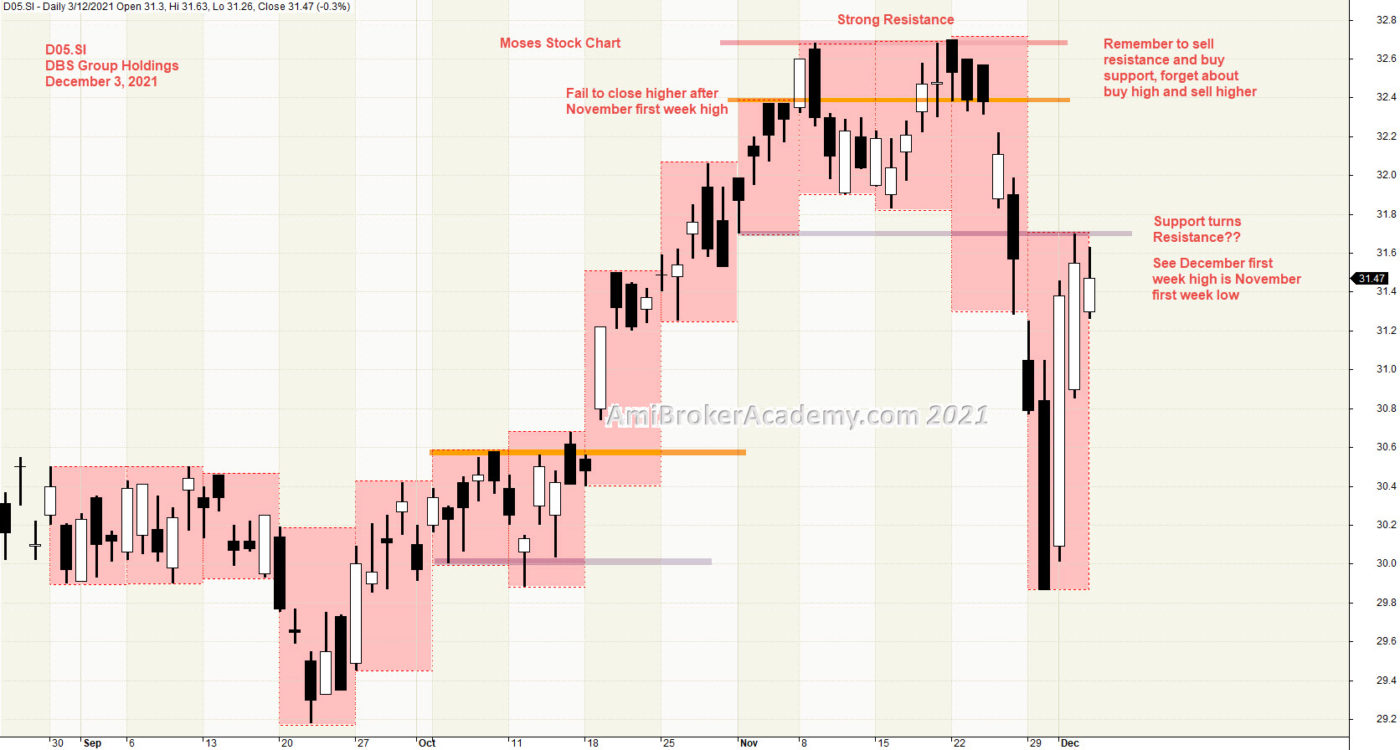
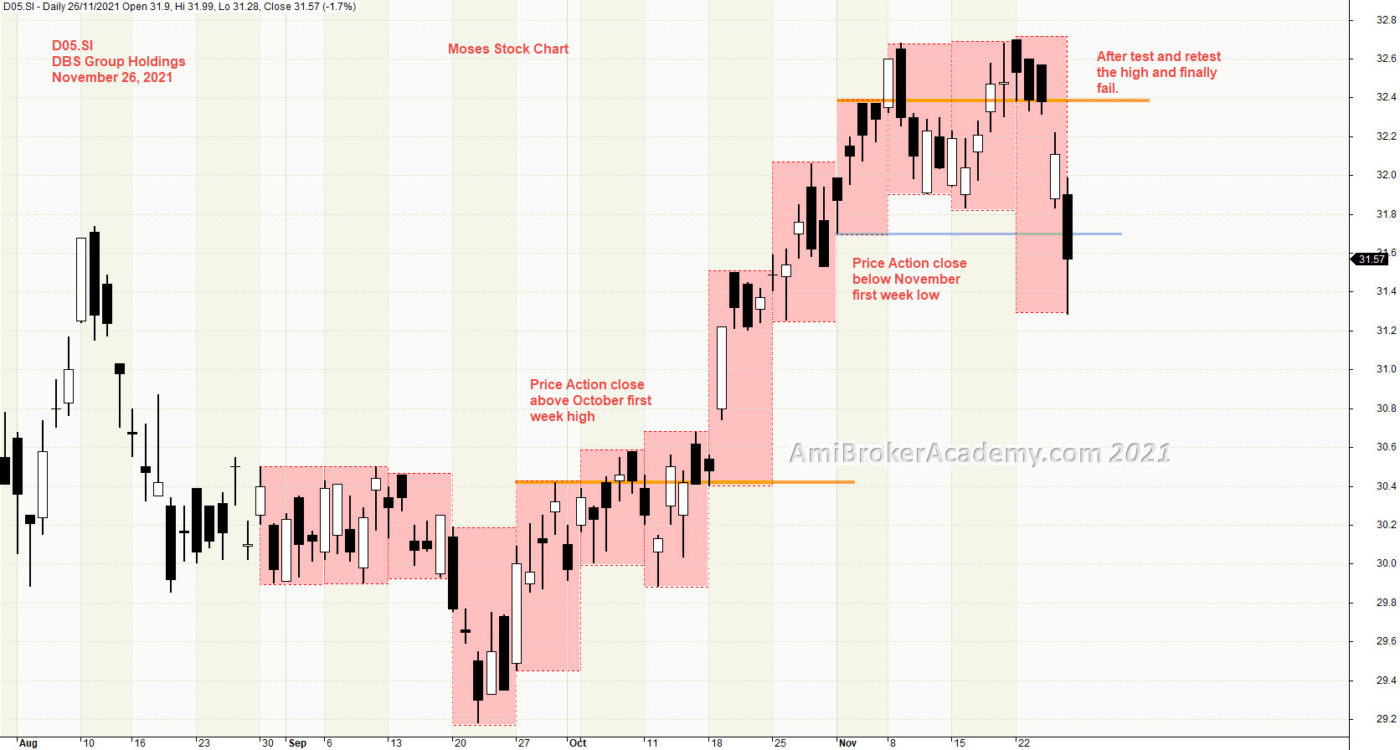
1) DBS Group Holdings and Week High Low Update
We post an analysis on end last month, we see the trend is bear.
Picture worth a thousand words. Price Action test, retest near 32.8 dollars high and fail. That was our previous analysis. When the price action close below the first week (November) low, we should expect the price action is begin to bearish. To add new position is to bet the price action will reverse. Of course anything can happen. We would ask, can the price action continue to go lower? May be, especially the price action goes below first week high, and the next three weeks the price action hitting the same resistance level. Strong Level.
See chart.
Can Price Action return higher? Of course, but the question is when.
If you are a buy and hold strategist, Will you sell now or buy now? Remember only buy near support, or sell resistance. Wait for the price action draw near the resistance before sell.
Moses Power Charting
Official AmiBrokerAcademy.com Charting
Disclaimer
The above result is for illustration purpose. It is meant to be used for learning buy or sell signals. We do not recommend for any particular stocks. If particular stocks of such are mentioned, they are meant as a demonstration of Amibroker as a powerful charting software. Amibroker is a charting software, it can program to scan the stocks for buy and sell signals. Or backtest for any trading strategy or technique.
We post script generated signals. Not all scan results are shown here depending on selection criterial. The MACD signal should use with price action. Users must understand what MACD and price action are all about before using them. If necessary you should attend a course to learn more on Technical Analysis (TA) and Moving Average Convergence Divergence, MACD.
Once again, the website does not guarantee any results or investment return based on the information and instruction you have read here. It should be used as learning aids only and if you decide to trade real money, all trading decision should be your own.
We learn from many past and present great traders. Kudo to these master.
Welcome to AmiBroker Academy dot com, amibrokeracademy.com.
If There is Only One Chart This is It
This is not a site that provides buy or sell signals directly. We read the stock chart bar by bar. If you understand what we read, you will get the buy or sell idea. Have fun!
Buy or Sell, you decide
Trading is very simple yet very difficult. Price is either up or down. But catch the right move is not easy. I believe many must have missed the falling knife. Now, many will be watching the topping. Can any catch the topping? Will see.
Up Down or Sideways
Trading is all probability. The price action is either up, down or sideways.
Trade what you see. Manage your risk.
Our Believe – Buy Support Sell Resistance.
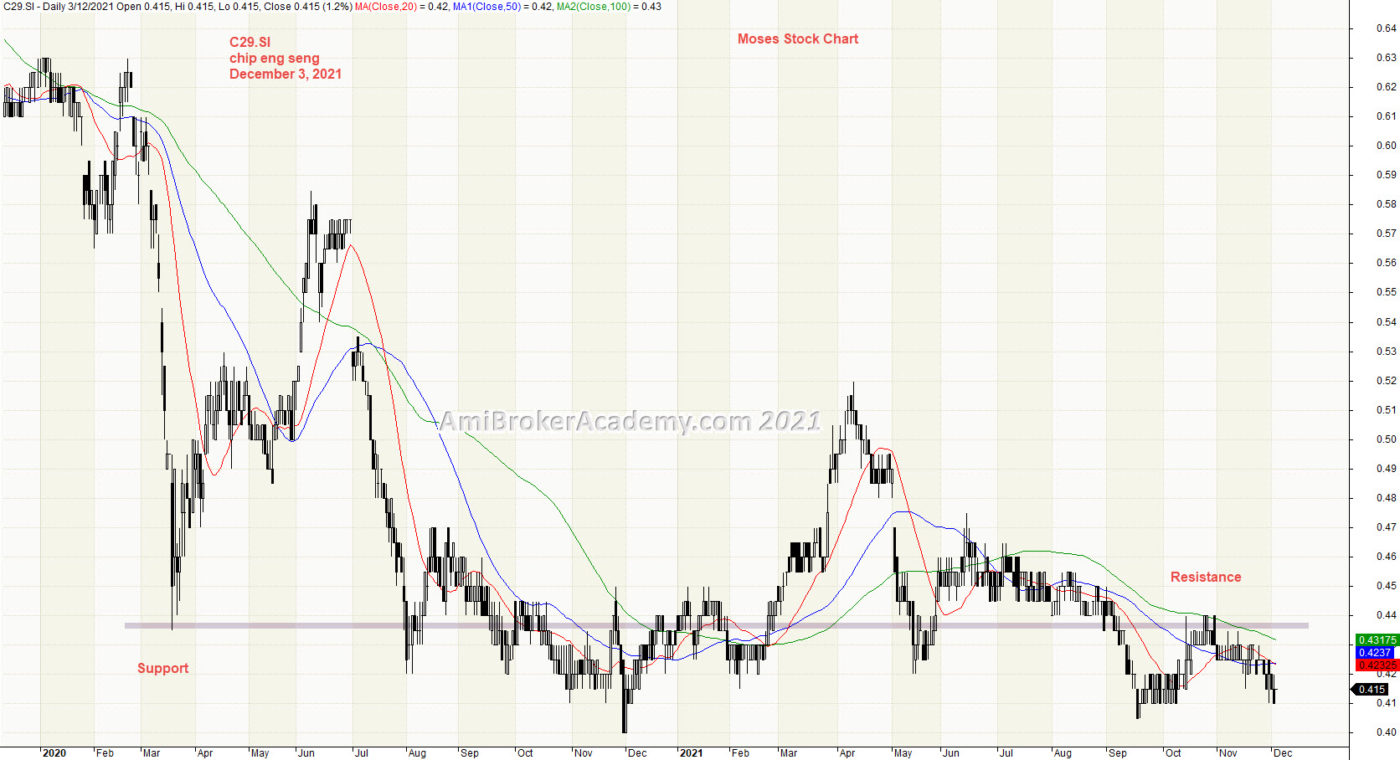
1) Chip Eng Seng C29
Picture worth a thousand words. Zoom out and see a bigger picture. Price Action fall like a falling knife from start of 2020. But quickly the price action regain energy and bounce up. But fail again. Some of you may say why can’t the price action return to the same high again. Sure can. But the business will be all different. You have to understand, the term recovery is only a phrase. The true is the revenue are all new. Price Action has continue to go lower after try to gain the high. Now the price Action is below the support turns resistance.
We did a zoom in analysis, please check it out.
See chart.
20211203 Chip Eng Seng and moving averages
Moses Power Charting
Official AmiBrokerAcademy.com Charting
Disclaimer
The above result is for illustration purpose. It is meant to be used for learning buy or sell signals. We do not recommend for any particular stocks. If particular stocks of such are mentioned, they are meant as a demonstration of Amibroker as a powerful charting software. Amibroker is a charting software, it can program to scan the stocks for buy and sell signals. Or backtest for any trading strategy or technique.
We post script generated signals. Not all scan results are shown here depending on selection criterial. The MACD signal should use with price action. Users must understand what MACD and price action are all about before using them. If necessary you should attend a course to learn more on Technical Analysis (TA) and Moving Average Convergence Divergence, MACD.
Once again, the website does not guarantee any results or investment return based on the information and instruction you have read here. It should be used as learning aids only and if you decide to trade real money, all trading decision should be your own.
We learn from many past and present great traders. Kudo to these master.
Welcome to AmiBroker Academy dot com, amibrokeracademy.com.
If There is Only One Chart This is It
This is not a site that provides buy or sell signals directly. We read the stock chart bar by bar. If you understand what we read, you will get the buy or sell idea. Have fun!
Buy or Sell, you decide
Trading is very simple yet very difficult. Price is either up or down. But catch the right move is not easy. I believe many must have missed the falling knife. Now, many will be watching the topping. Can any catch the topping? Will see.
Up Down or Sideways
Trading is all probability. The price action is either up, down or sideways.
Trade what you see. Manage your risk.
Our Believe – Buy Support Sell Resistance.
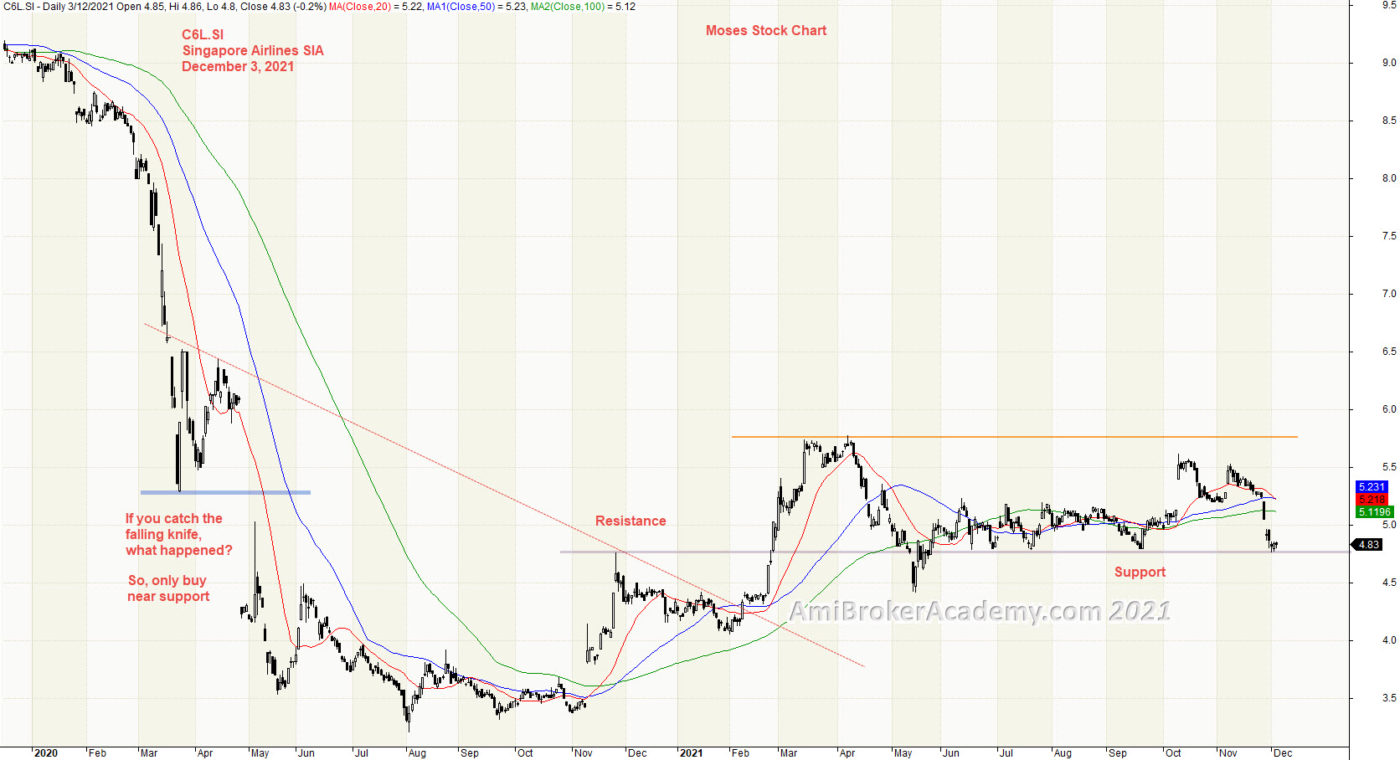
1) C6L Singapore Airlines
Picture worth a thousand words. See the big picture. We stand back to see price action from beginning of 2020, when the price action was above nine (9) dollars. Price Action fail like a falling knife. In has a dead cat bounce reversal fail too. Price Action breakout below support and go lower to below three fifty (3.5) dollars. You could see a cup and handle pattern. Price Action now fail again after test the high near six dollars.
See chart. We did a zoom in analysis to see when the price action might move next. Please check it out.
20211203 Singapore Airlines and Moving Averages
Moses Power Charting
Official AmiBrokerAcademy.com Charting
Disclaimer
The above result is for illustration purpose. It is meant to be used for learning buy or sell signals. We do not recommend for any particular stocks. If particular stocks of such are mentioned, they are meant as a demonstration of Amibroker as a powerful charting software. Amibroker is a charting software, it can program to scan the stocks for buy and sell signals. Or backtest for any trading strategy or technique.
We post script generated signals. Not all scan results are shown here depending on selection criterial. The MACD signal should use with price action. Users must understand what MACD and price action are all about before using them. If necessary you should attend a course to learn more on Technical Analysis (TA) and Moving Average Convergence Divergence, MACD.
Once again, the website does not guarantee any results or investment return based on the information and instruction you have read here. It should be used as learning aids only and if you decide to trade real money, all trading decision should be your own.
We learn from many past and present great traders. Kudo to these master.
Welcome to AmiBroker Academy dot com, amibrokeracademy.com.
If There is Only One Chart This is It
This is not a site that provides buy or sell signals directly. We read the stock chart bar by bar. If you understand what we read, you will get the buy or sell idea. Have fun!
Buy or Sell, you decide
Trading is very simple yet very difficult. Price is either up or down. But catch the right move is not easy. I believe many must have missed the falling knife. Now, many will be watching the topping. Can any catch the topping? Will see.
Up Down or Sideways
Trading is all probability. The price action is either up, down or sideways.
Trade what you see. Manage your risk.
Our Believe – Buy Support Sell Resistance.
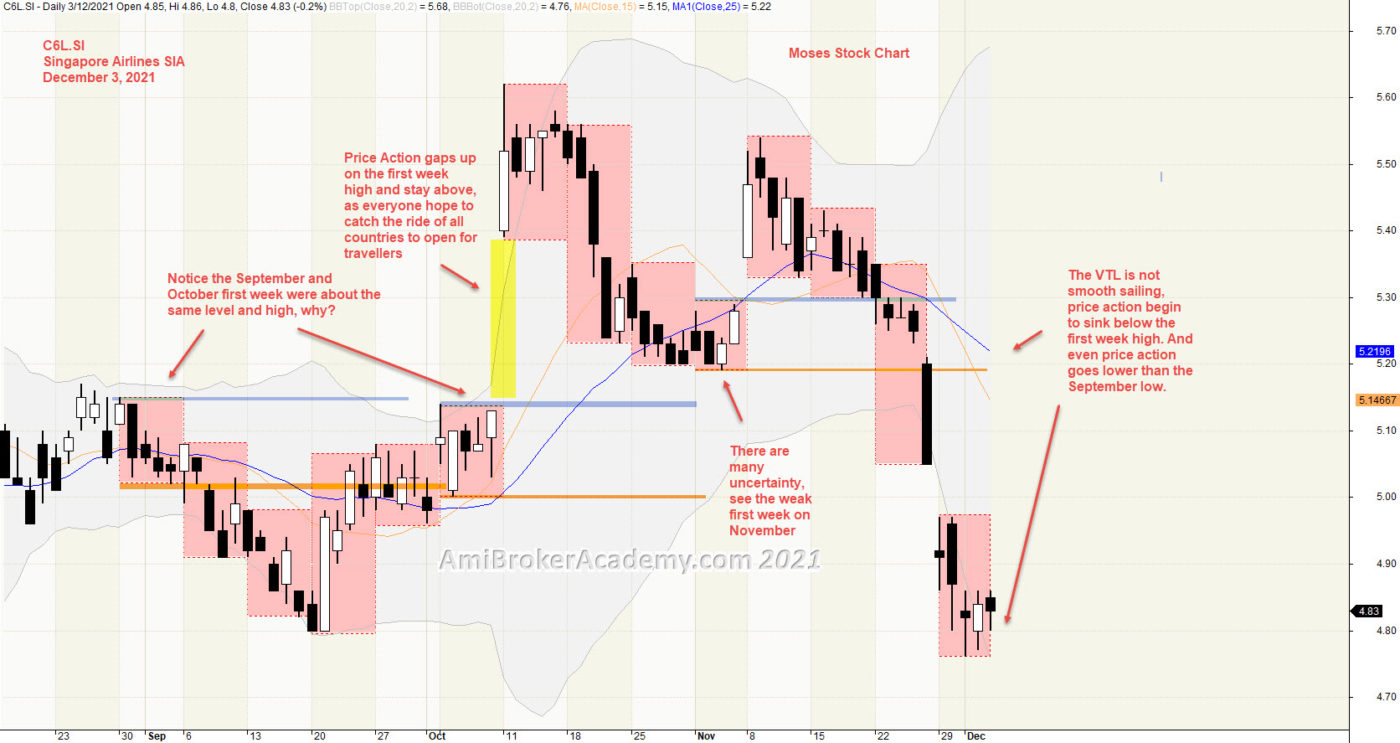
1) C6L Singapore Airlines week High Low
Picture worth a thousand words. Price Action breakout below September first week low and bounce back up first week of October. Price Action continues to go higher after October first week high. In fact, price action gap up. As every trader believe, that the price action will cover the gap. It is so soon that price action cover the gap in November.
See chart.
If you are a buy and hold strategist, Will you sell now or buy now? Remember only buy near support, and sell near resistance. Wait for the price action draw near either resistance or support.
From the chart, price action is now near the support zone.
20211203 Singapore Airlines week High Low
Moses Power Charting
Official AmiBrokerAcademy.com Charting
Disclaimer
The above result is for illustration purpose. It is meant to be used for learning buy or sell signals. We do not recommend for any particular stocks. If particular stocks of such are mentioned, they are meant as a demonstration of Amibroker as a powerful charting software. Amibroker is a charting software, it can program to scan the stocks for buy and sell signals. Or backtest for any trading strategy or technique.
We post script generated signals. Not all scan results are shown here depending on selection criterial. The MACD signal should use with price action. Users must understand what MACD and price action are all about before using them. If necessary you should attend a course to learn more on Technical Analysis (TA) and Moving Average Convergence Divergence, MACD.
Once again, the website does not guarantee any results or investment return based on the information and instruction you have read here. It should be used as learning aids only and if you decide to trade real money, all trading decision should be your own.
We learn from many past and present great traders. Kudo to these master.
Welcome to AmiBroker Academy dot com, amibrokeracademy.com.
If There is Only One Chart This is It
This is not a site that provides buy or sell signals directly. We read the stock chart bar by bar. If you understand what we read, you will get the buy or sell idea. Have fun!
Buy or Sell, you decide
Trading is very simple yet very difficult. Price is either up or down. But catch the right move is not easy. I believe many must have missed the falling knife. Now, many will be watching the topping. Can any catch the topping? Will see.
Up Down or Sideways
Trading is all probability. The price action is either up, down or sideways.
Trade what you see. Manage your risk.
Our Believe – Buy Support Sell Resistance.
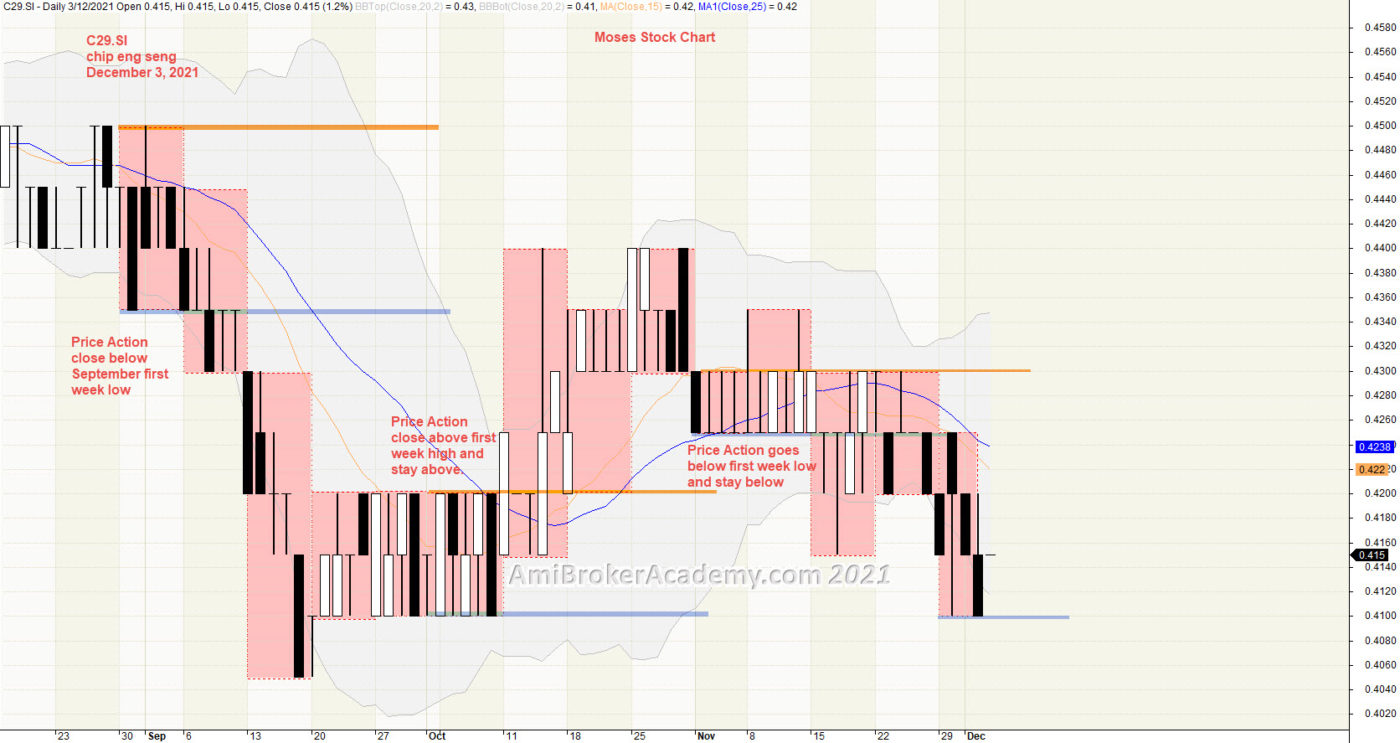
1) Chip Eng Seng and Week High Low
Picture worth a thousand words. Price Action breakout below September first week low and go lower, price action bounce back up and breakout first week of October high. Price Action next begin to close below November first week low. So, price action goes down, come up and goes down again. Now in December. Price Action may goes up or down. So, what is you guess?
See chart.
If you are a buy and hold strategist, Will you sell now or buy now? Remember only buy near support, and sell near resistance. Wait for the price action draw near either resistance or support.
From the overall view, price action is now near the support zone.
20211203 Chip Eng Seng and Week High Low
Moses Power Charting
Official AmiBrokerAcademy.com Charting
Disclaimer
The above result is for illustration purpose. It is meant to be used for learning buy or sell signals. We do not recommend for any particular stocks. If particular stocks of such are mentioned, they are meant as a demonstration of Amibroker as a powerful charting software. Amibroker is a charting software, it can program to scan the stocks for buy and sell signals. Or backtest for any trading strategy or technique.
We post script generated signals. Not all scan results are shown here depending on selection criterial. The MACD signal should use with price action. Users must understand what MACD and price action are all about before using them. If necessary you should attend a course to learn more on Technical Analysis (TA) and Moving Average Convergence Divergence, MACD.
Once again, the website does not guarantee any results or investment return based on the information and instruction you have read here. It should be used as learning aids only and if you decide to trade real money, all trading decision should be your own.
We learn from many past and present great traders. Kudo to these master.
Welcome to AmiBroker Academy dot com, amibrokeracademy.com.
If There is Only One Chart This is It
This is not a site that provides buy or sell signals directly. We read the stock chart bar by bar. If you understand what we read, you will get the buy or sell idea. Have fun!
Buy or Sell, you decide
Trading is very simple yet very difficult. Price is either up or down. But catch the right move is not easy. I believe many must have missed the falling knife. Now, many will be watching the topping. Can any catch the topping? Will see.
Up Down or Sideways
Trading is all probability. The price action is either up, down or sideways.
Trade what you see. Manage your risk.
Our Believe – Buy Support Sell Resistance.
1) Hotung Investment Holdings and Week High Low
Picture worth a thousand words. Price Action breakout September first week low and go lower, next price action bounce back up. Price Action begin to go higher. On October price action goes higher than first week high. price action continue to go higher in November first week high. Price Action test the high and fail.
See chart.
As usual, what is your view, will Price Action really pullback and test the November first week high?
If you are a buy and hold strategist, Will you sell now or buy now? Remember only buy near support, and sell near resistance. Wait for the price action draw near either resistance or support.
20211202 Hotung Investment Holdings and week High Low
Moses Power Charting
Official AmiBrokerAcademy.com Charting
Disclaimer
The above result is for illustration purpose. It is meant to be used for learning buy or sell signals. We do not recommend for any particular stocks. If particular stocks of such are mentioned, they are meant as a demonstration of Amibroker as a powerful charting software. Amibroker is a charting software, it can program to scan the stocks for buy and sell signals. Or backtest for any trading strategy or technique.
We post script generated signals. Not all scan results are shown here depending on selection criterial. The MACD signal should use with price action. Users must understand what MACD and price action are all about before using them. If necessary you should attend a course to learn more on Technical Analysis (TA) and Moving Average Convergence Divergence, MACD.
Once again, the website does not guarantee any results or investment return based on the information and instruction you have read here. It should be used as learning aids only and if you decide to trade real money, all trading decision should be your own.
We learn from many past and present great traders. Kudo to these master.
Welcome to AmiBroker Academy dot com, amibrokeracademy.com.
If There is Only One Chart This is It
This is not a site that provides buy or sell signals directly. We read the stock chart bar by bar. If you understand what we read, you will get the buy or sell idea. Have fun!
Buy or Sell, you decide
Trading is very simple yet very difficult. Price is either up or down. But catch the right move is not easy. I believe many must have missed the falling knife. Now, many will be watching the topping. Can any catch the topping? Will see.
Up Down or Sideways
Trading is all probability. The price action is either up, down or sideways.
Trade what you see. Manage your risk.
Our Believe – Buy Support Sell Resistance.
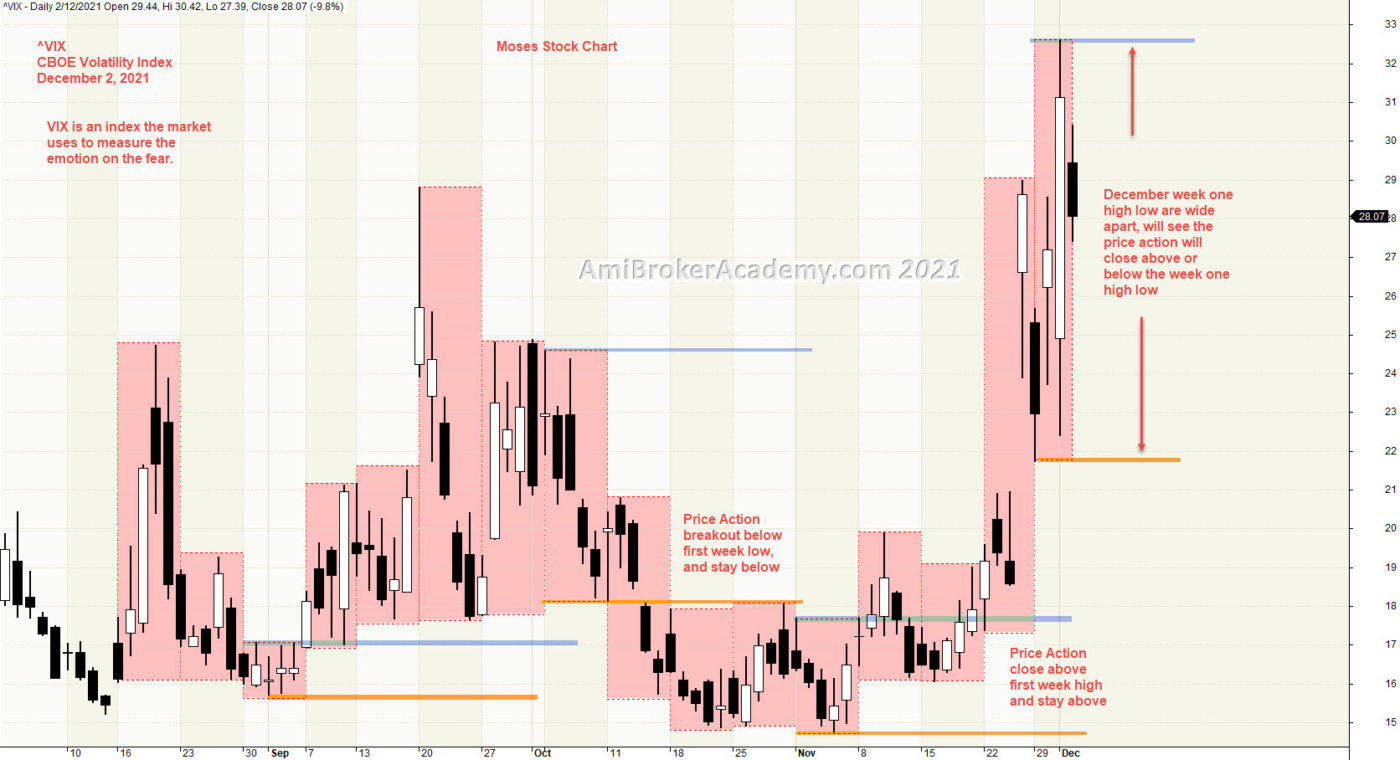
1) CBOE Volatility Index week high low
Picture worth a thousand words. Price Action breakout September first week high and stay above, but price action pullback. Price Action begin to go lower on October first week low. Next, price action close above November first week high. Price Action goes up, come down. The market is very volatile.
See chart.
As usual, what is your view, can Price Action return back high again?
If you are a buy and hold strategist, Will you sell now or buy now? Remember only buy near support, and sell near resistance. Wait for the price action draw near either resistance or support.
20211202 CBOE Volatility Index week high low
Moses Power Charting
Official AmiBrokerAcademy.com Charting
Disclaimer
The above result is for illustration purpose. It is meant to be used for learning buy or sell signals. We do not recommend for any particular stocks. If particular stocks of such are mentioned, they are meant as a demonstration of Amibroker as a powerful charting software. Amibroker is a charting software, it can program to scan the stocks for buy and sell signals. Or backtest for any trading strategy or technique.
We post script generated signals. Not all scan results are shown here depending on selection criterial. The MACD signal should use with price action. Users must understand what MACD and price action are all about before using them. If necessary you should attend a course to learn more on Technical Analysis (TA) and Moving Average Convergence Divergence, MACD.
Once again, the website does not guarantee any results or investment return based on the information and instruction you have read here. It should be used as learning aids only and if you decide to trade real money, all trading decision should be your own.
We learn from many past and present great traders. Kudo to these master.
Welcome to AmiBroker Academy dot com, amibrokeracademy.com.
If There is Only One Chart This is It
This is not a site that provides buy or sell signals directly. We read the stock chart bar by bar. If you understand what we read, you will get the buy or sell idea. Have fun!
Buy or Sell, you decide
Trading is very simple yet very difficult. Price is either up or down. But catch the right move is not easy. I believe many must have missed the falling knife. Now, many will be watching the topping. Can any catch the topping? Will see.
Up Down or Sideways
Trading is all probability. The price action is either up, down or sideways.
Trade what you see. Manage your risk.
Our Believe – Buy Support Sell Resistance.
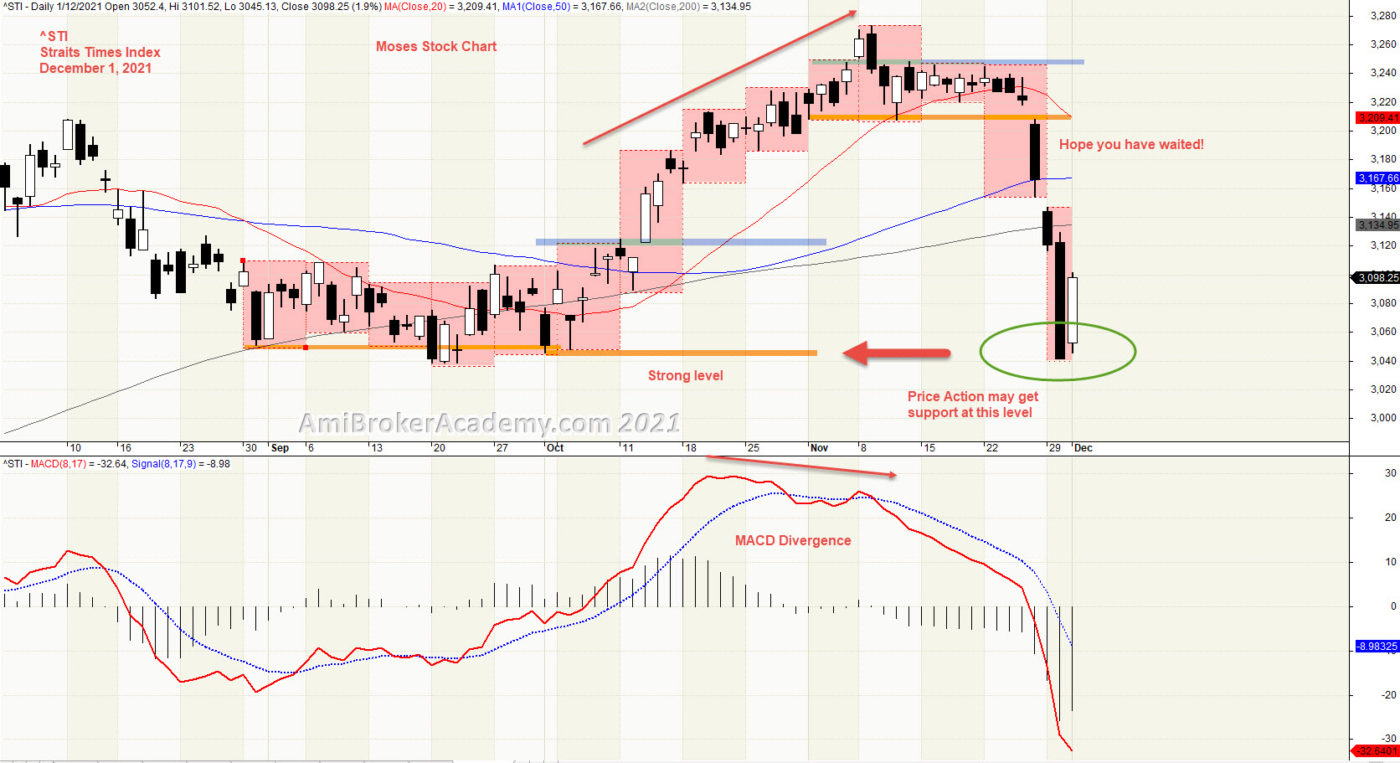
1) Straits Times Index and MACD Divergence
Picture worth a thousand words. Price Action breakout October first week high, but price action fail after breakout first week high of November. Price Action begin to pullback. When the price action could not hold the fall.
See chart.
As usual, what is your view, can Price Action return back higher?
If you are a buy and hold strategist, Will you sell now or buy now? Remember only buy near support, and sell near resistance. Wait for the price action draw near either resistance or support.
September low and October low are near the same level, become very strong support. So, price action may rebounce near the strong level. Manage your risk.
20211201 Straits Times Index and MACD
Moses Power Charting
Official AmiBrokerAcademy.com Charting
Disclaimer
The above result is for illustration purpose. It is meant to be used for learning buy or sell signals. We do not recommend for any particular stocks. If particular stocks of such are mentioned, they are meant as a demonstration of Amibroker as a powerful charting software. Amibroker is a charting software, it can program to scan the stocks for buy and sell signals. Or backtest for any trading strategy or technique.
We post script generated signals. Not all scan results are shown here depending on selection criterial. The MACD signal should use with price action. Users must understand what MACD and price action are all about before using them. If necessary you should attend a course to learn more on Technical Analysis (TA) and Moving Average Convergence Divergence, MACD.
Once again, the website does not guarantee any results or investment return based on the information and instruction you have read here. It should be used as learning aids only and if you decide to trade real money, all trading decision should be your own.
We learn from many past and present great traders. Kudo to these master.
Welcome to AmiBroker Academy dot com, amibrokeracademy.com.
If There is Only One Chart This is It
This is not a site that provides buy or sell signals directly. We read the stock chart bar by bar. If you understand what we read, you will get the buy or sell idea. Have fun!
Buy or Sell, you decide
Trading is very simple yet very difficult. Price is either up or down. But catch the right move is not easy. I believe many must have missed the falling knife. Now, many will be watching the topping. Can any catch the topping? Will see.
Up Down or Sideways
Trading is all probability. The price action is either up, down or sideways.
Trade what you see. Manage your risk.
Our Believe – Buy Support Sell Resistance.
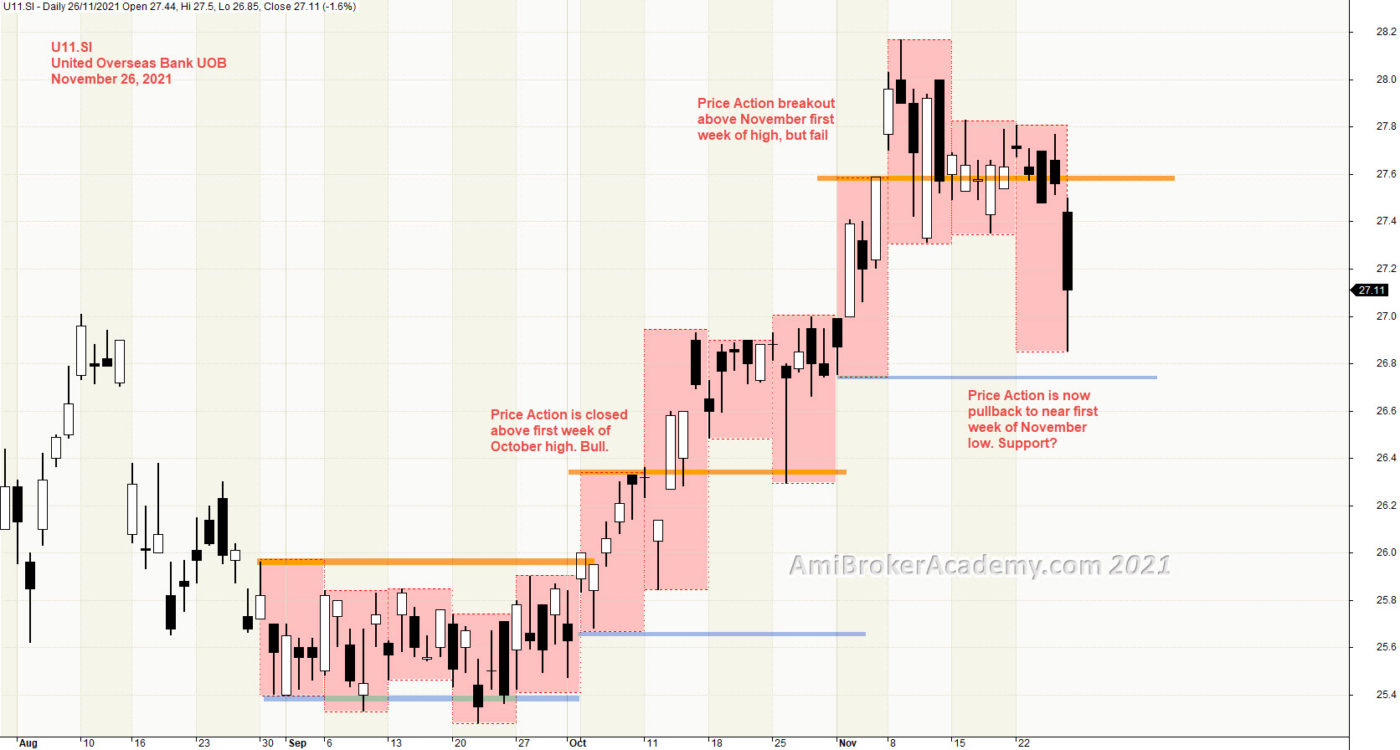
1) United Overseas Bank Week High Low
Picture worth a thousand words. Price Action breakout October first week high, but after price action fail after breakout first week of November. Price Action begin to pullback. When the price action could not hold the fall by the November first week low, the price action will continue to go lower. Trade with eyes open.
See chart.
As usual, what is your view, can Price Action return back higher?
If you are a buy and hold strategist, Will you sell now or buy now? Remember only buy near support, and sell near resistance. Wait for the price action draw near either resistance or support.
20211126 United Overseas Bank Week High Low
Moses Power Charting
Official AmiBrokerAcademy.com Charting
Disclaimer
The above result is for illustration purpose. It is meant to be used for learning buy or sell signals. We do not recommend for any particular stocks. If particular stocks of such are mentioned, they are meant as a demonstration of Amibroker as a powerful charting software. Amibroker is a charting software, it can program to scan the stocks for buy and sell signals. Or backtest for any trading strategy or technique.
We post script generated signals. Not all scan results are shown here depending on selection criterial. The MACD signal should use with price action. Users must understand what MACD and price action are all about before using them. If necessary you should attend a course to learn more on Technical Analysis (TA) and Moving Average Convergence Divergence, MACD.
Once again, the website does not guarantee any results or investment return based on the information and instruction you have read here. It should be used as learning aids only and if you decide to trade real money, all trading decision should be your own.
We learn from many past and present great traders. Kudo to these master.
Welcome to AmiBroker Academy dot com, amibrokeracademy.com.
If There is Only One Chart This is It
This is not a site that provides buy or sell signals directly. We read the stock chart bar by bar. If you understand what we read, you will get the buy or sell idea. Have fun!
Buy or Sell, you decide
Trading is very simple yet very difficult. Price is either up or down. But catch the right move is not easy. I believe many must have missed the falling knife. Now, many will be watching the topping. Can any catch the topping? Will see.
Up Down or Sideways
Trading is all probability. The price action is either up, down or sideways.
Trade what you see. Manage your risk.
Our Believe – Buy Support Sell Resistance.
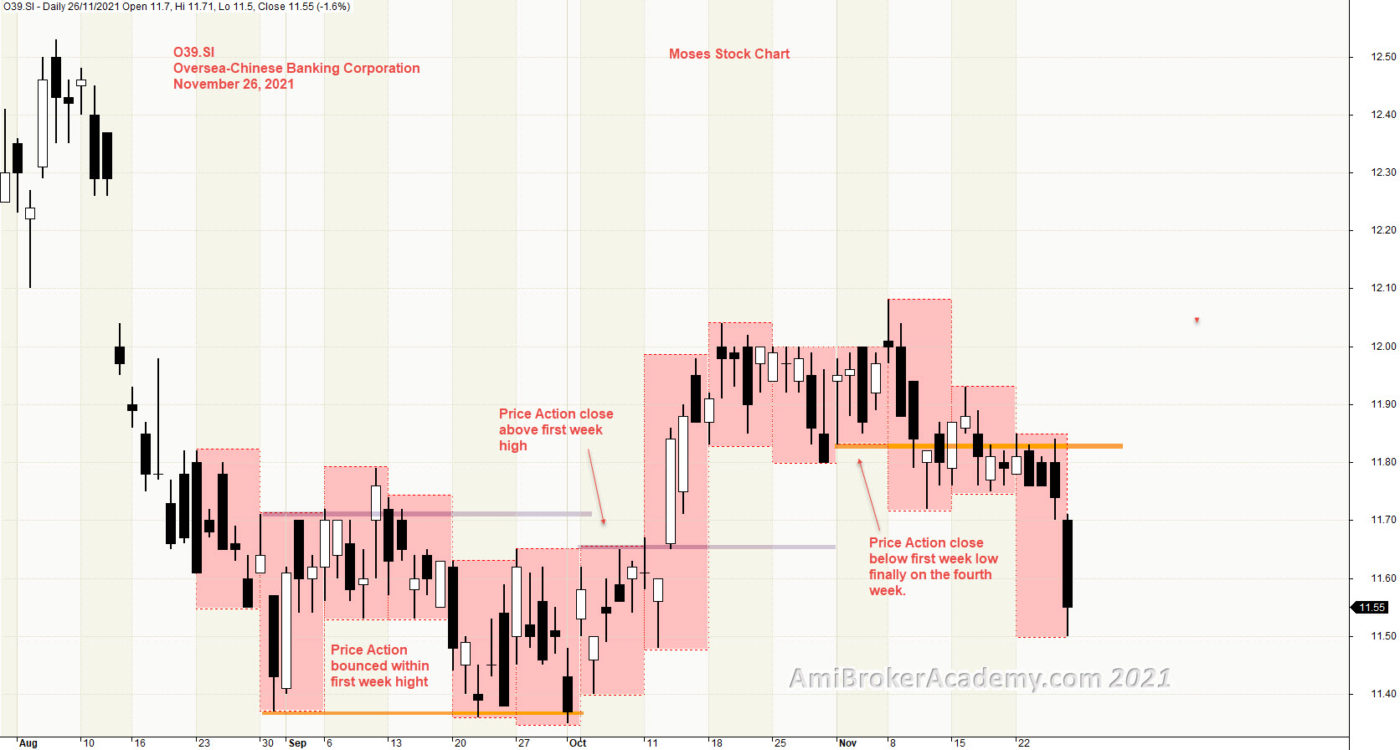
1) Oversea-Chinese Banking Corporation and week high low
Picture worth a thousand words. Price Action test the low and retest. Price Action rebounce up. See the in deep analysis, price action close above first week of October and stay above until price actopm close below first week November.
See chart.
Can Price Action return back higher? Of course maybe. As price action can only go high, low or sideways.
If you are a buy and hold strategist, Will you sell now or buy now? Remember only buy near support, and sell near resistance. Wait for the price action draw near either resistance or support.
20211126 Oversea-Chinese Banking Corporation and week high low
Moses Power Charting
Official AmiBrokerAcademy.com Charting
Disclaimer
The above result is for illustration purpose. It is meant to be used for learning buy or sell signals. We do not recommend for any particular stocks. If particular stocks of such are mentioned, they are meant as a demonstration of Amibroker as a powerful charting software. Amibroker is a charting software, it can program to scan the stocks for buy and sell signals. Or backtest for any trading strategy or technique.
We post script generated signals. Not all scan results are shown here depending on selection criterial. The MACD signal should use with price action. Users must understand what MACD and price action are all about before using them. If necessary you should attend a course to learn more on Technical Analysis (TA) and Moving Average Convergence Divergence, MACD.
Once again, the website does not guarantee any results or investment return based on the information and instruction you have read here. It should be used as learning aids only and if you decide to trade real money, all trading decision should be your own.
We learn from many past and present great traders. Kudo to these master.
Welcome to AmiBroker Academy dot com, amibrokeracademy.com.
If There is Only One Chart This is It
This is not a site that provides buy or sell signals directly. We read the stock chart bar by bar. If you understand what we read, you will get the buy or sell idea. Have fun!
Buy or Sell, you decide
Trading is very simple yet very difficult. Price is either up or down. But catch the right move is not easy. I believe many must have missed the falling knife. Now, many will be watching the topping. Can any catch the topping? Will see.
Up Down or Sideways
Trading is all probability. The price action is either up, down or sideways.
Trade what you see. Manage your risk.
Our Believe – Buy Support Sell Resistance.
1) DBS Group Holdings and Week High Lows
Picture worth a thousand words. Price Action test, retest near 32.8 dollars. Price Action after test near 32.8 dollars and fail. Can the price action continue to go lower? May be, especially the price action goes below first week high.
See chart.
Can Price Action return higher? Of course, but the question is when.
If you are a buy and hold strategist, Will you sell now or buy now? Remember only buy near support, or sell resistance. Wait for the price action draw near the resistance before sell.
20211126 DBS Group Holdings and Week High Low
Moses Power Charting
Official AmiBrokerAcademy.com Charting
Disclaimer
The above result is for illustration purpose. It is meant to be used for learning buy or sell signals. We do not recommend for any particular stocks. If particular stocks of such are mentioned, they are meant as a demonstration of Amibroker as a powerful charting software. Amibroker is a charting software, it can program to scan the stocks for buy and sell signals. Or backtest for any trading strategy or technique.
We post script generated signals. Not all scan results are shown here depending on selection criterial. The MACD signal should use with price action. Users must understand what MACD and price action are all about before using them. If necessary you should attend a course to learn more on Technical Analysis (TA) and Moving Average Convergence Divergence, MACD.
Once again, the website does not guarantee any results or investment return based on the information and instruction you have read here. It should be used as learning aids only and if you decide to trade real money, all trading decision should be your own.
We learn from many past and present great traders. Kudo to these master.
Welcome to AmiBroker Academy dot com, amibrokeracademy.com.
If There is Only One Chart This is It
This is not a site that provides buy or sell signals directly. We read the stock chart bar by bar. If you understand what we read, you will get the buy or sell idea. Have fun!
Buy or Sell, you decide
Trading is very simple yet very difficult. Price is either up or down. But catch the right move is not easy. I believe many must have missed the falling knife. Now, many will be watching the topping. Can any catch the topping? Will see.
Up Down or Sideways
Trading is all probability. The price action is either up, down or sideways.
Trade what you see. Manage your risk.
Our Believe – Buy Support Sell Resistance.
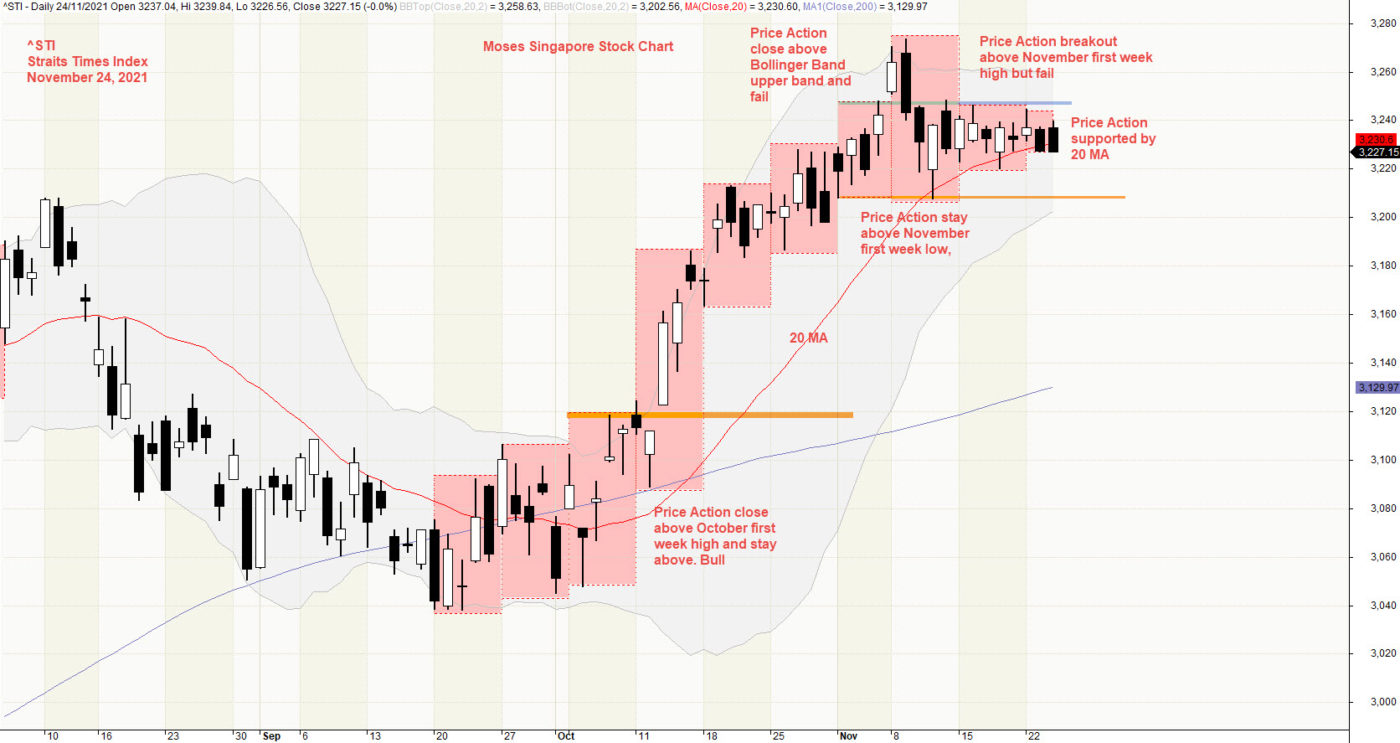
1) Straits Times Index and Week High Low
Picture worth a thousand words. Price Action test, retest 3300 level. Price Action is closed above first week of October. Price Action continue to go higher. Price Action breakout above first week of November but fail. Price Action stay above first week November low and stay above. If price action continue to stay above first week low, and first week high, sideways. 3300 level will be a very strong level at least for now.
See chart.
Can Price Action continues to go higher? May be. Can price action go below? Possible too.
If you are a buy and hold strategist, Will you sell now or buy? Remember only buy near support, or sell resistance. Wait for the price action draw near the resistance before sell.
20211124 Straits Times Index and Week High Low
Moses Power Charting
Official AmiBrokerAcademy.com Charting
Disclaimer
The above result is for illustration purpose. It is meant to be used for learning buy or sell signals. We do not recommend for any particular stocks. If particular stocks of such are mentioned, they are meant as a demonstration of Amibroker as a powerful charting software. Amibroker is a charting software, it can program to scan the stocks for buy and sell signals. Or backtest for any trading strategy or technique.
We post script generated signals. Not all scan results are shown here depending on selection criterial. The MACD signal should use with price action. Users must understand what MACD and price action are all about before using them. If necessary you should attend a course to learn more on Technical Analysis (TA) and Moving Average Convergence Divergence, MACD.
Once again, the website does not guarantee any results or investment return based on the information and instruction you have read here. It should be used as learning aids only and if you decide to trade real money, all trading decision should be your own.
We learn from many past and present great traders. Kudo to these master.
Welcome to AmiBroker Academy dot com, amibrokeracademy.com.
If There is Only One Chart This is It
This is not a site that provides buy or sell signals directly. We read the stock chart bar by bar. If you understand what we read, you will get the buy or sell idea. Have fun!
Buy or Sell, you decide
Trading is very simple yet very difficult. Price is either up or down. But catch the right move is not easy. I believe many must have missed the falling knife. Now, many will be watching the topping. Can any catch the topping? Will see.
Up Down or Sideways
Trading is all probability. The price action is either up, down or sideways.
Trade what you see. Manage your risk.
Our Believe – Buy Support Sell Resistance.
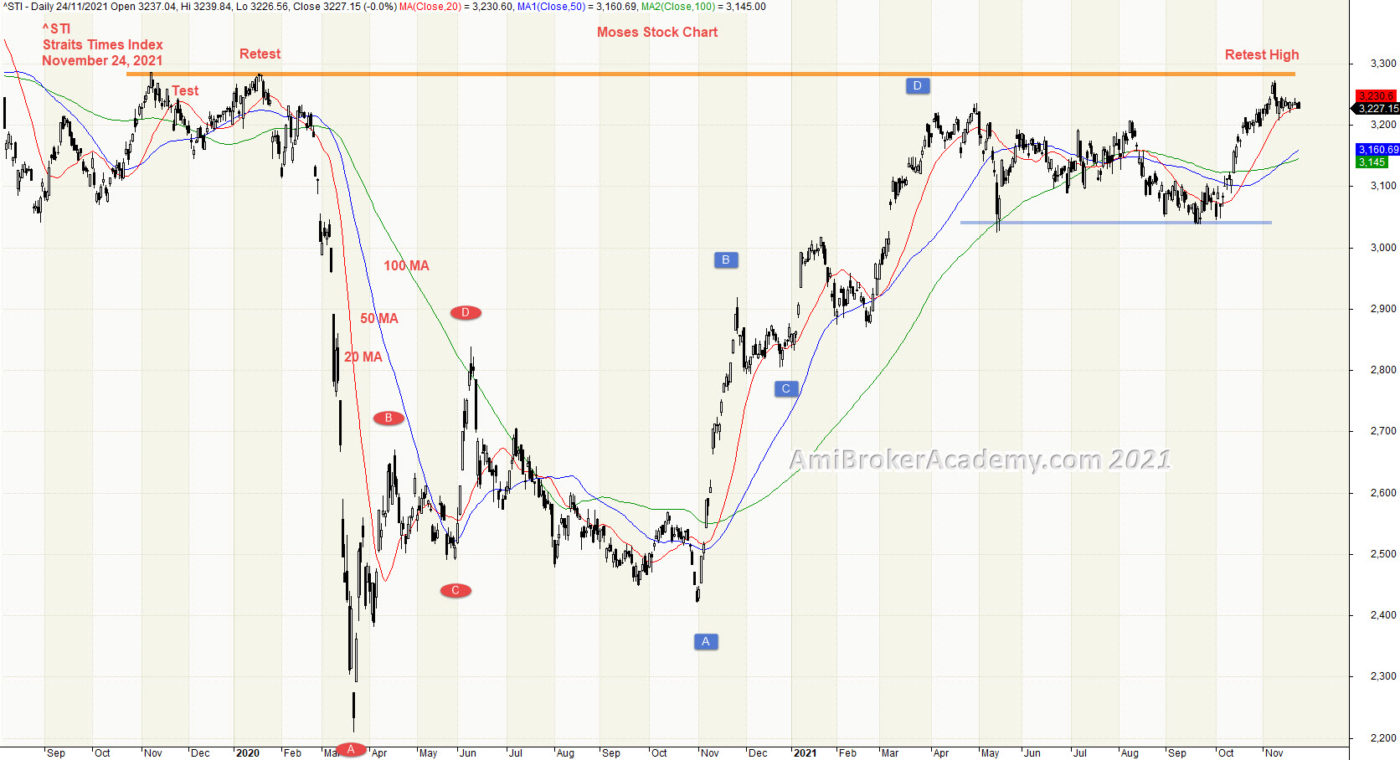
1) Straits Times Index and Moving Averages
Picture worth a thousand words. Price Action test, retest 3300 level. Price Action is now drawing near 3300 level again. The recent time the price action was near the 3300 level was the end of 2019, followed on at the beginning of 2020. Thereafter the price action has a dead cat bounce like fall from the 3300 level to the low near 2200 level, almost a 1000 points fall. Now the price action has finally returning to the 3300 level.
See chart.
Can Price Action continues to go higher? May be.
If you are a buy and hold strategist, Will you sell now or buy? Remember only buy near support, or sell resistance. Wait for the price action draw near the resistance before sell.
20211124 Straits Times Index and Moving Averages
Moses Power Charting
Official AmiBrokerAcademy.com Charting
Disclaimer
The above result is for illustration purpose. It is meant to be used for learning buy or sell signals. We do not recommend for any particular stocks. If particular stocks of such are mentioned, they are meant as a demonstration of Amibroker as a powerful charting software. Amibroker is a charting software, it can program to scan the stocks for buy and sell signals. Or backtest for any trading strategy or technique.
We post script generated signals. Not all scan results are shown here depending on selection criterial. The MACD signal should use with price action. Users must understand what MACD and price action are all about before using them. If necessary you should attend a course to learn more on Technical Analysis (TA) and Moving Average Convergence Divergence, MACD.
Once again, the website does not guarantee any results or investment return based on the information and instruction you have read here. It should be used as learning aids only and if you decide to trade real money, all trading decision should be your own.
We learn from many past and present great traders. Kudo to these master.
Welcome to AmiBroker Academy dot com, amibrokeracademy.com.
If There is Only One Chart This is It
This is not a site that provides buy or sell signals directly. We read the stock chart bar by bar. If you understand what we read, you will get the buy or sell idea. Have fun!
Buy or Sell, you decide
Trading is very simple yet very difficult. Price is either up or down. But catch the right move is not easy. I believe many must have missed the falling knife. Now, many will be watching the topping. Can any catch the topping? Will see.
Up Down or Sideways
Trading is all probability. The price action is either up, down or sideways.
Trade what you see. Manage your risk.
Our Believe – Buy Support Sell Resistance.
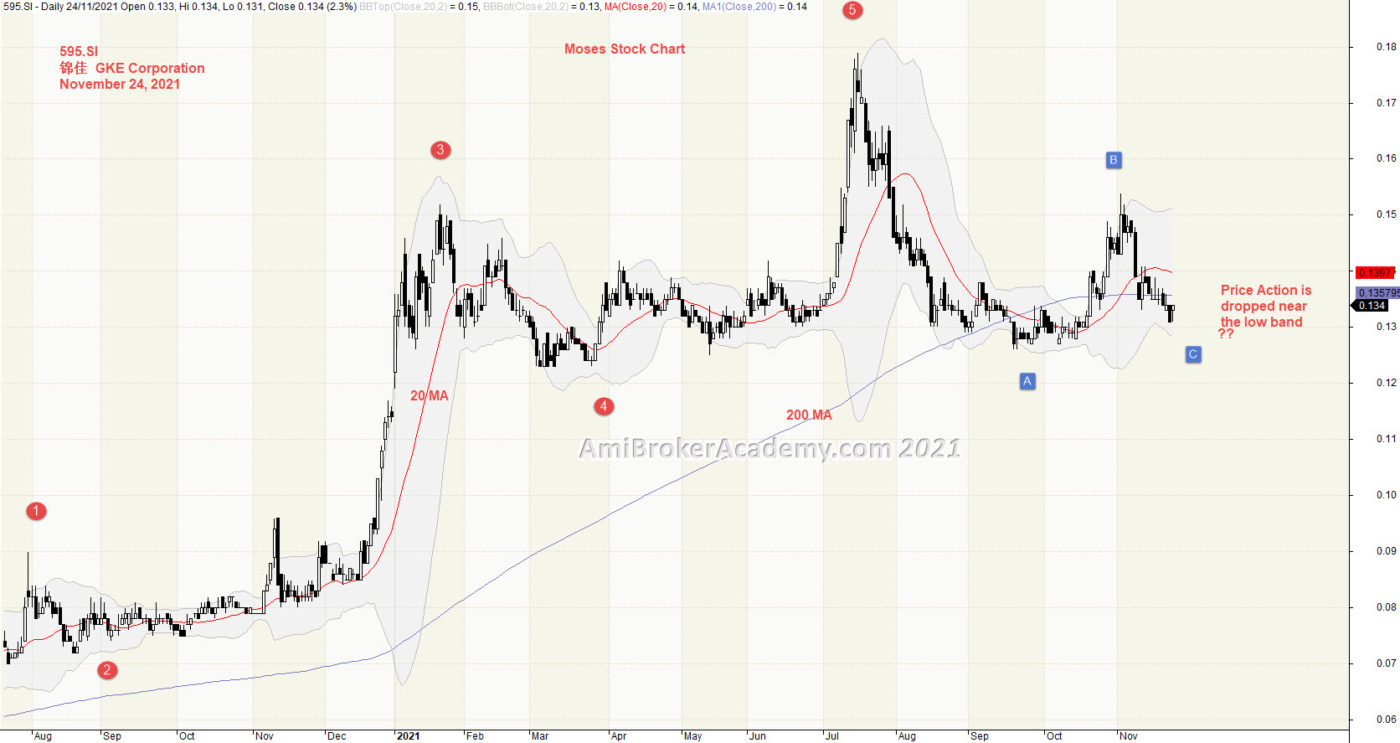
1) GKE Corp
Picture worth a thousand words. Price Action close below the middle line, 20 MA and draw near the lower band. Price Action is near support.
See chart.
Can Price Action continues to go lower? May be.
If you are a buy and hold strategist, Will you sell now? Remember only buy near support,or sell resistance. Wait for the price action near the resistance before sell.
20211124 GKE Corp and Bollinger Bands
Moses Power Charting
Official AmiBrokerAcademy.com Charting
Disclaimer
The above result is for illustration purpose. It is meant to be used for learning buy or sell signals. We do not recommend for any particular stocks. If particular stocks of such are mentioned, they are meant as a demonstration of Amibroker as a powerful charting software. Amibroker is a charting software, it can program to scan the stocks for buy and sell signals. Or backtest for any trading strategy or technique.
We post script generated signals. Not all scan results are shown here depending on selection criterial. The MACD signal should use with price action. Users must understand what MACD and price action are all about before using them. If necessary you should attend a course to learn more on Technical Analysis (TA) and Moving Average Convergence Divergence, MACD.
Once again, the website does not guarantee any results or investment return based on the information and instruction you have read here. It should be used as learning aids only and if you decide to trade real money, all trading decision should be your own.
We learn from many past and present great traders. Kudo to these master.
Welcome to AmiBroker Academy dot com, amibrokeracademy.com.
If There is Only One Chart This is It
This is not a site that provides buy or sell signals directly. We read the stock chart bar by bar. If you understand what we read, you will get the buy or sell idea. Have fun!
Buy or Sell, you decide
Trading is very simple yet very difficult. Price is either up or down. But catch the right move is not easy. I believe many must have missed the falling knife. Now, many will be watching the topping. Can any catch the topping? Will see.
Up Down or Sideways
Trading is all probability. The price action is either up, down or sideways.
Trade what you see. Manage your risk.
Our Believe – Buy Support Sell Resistance.
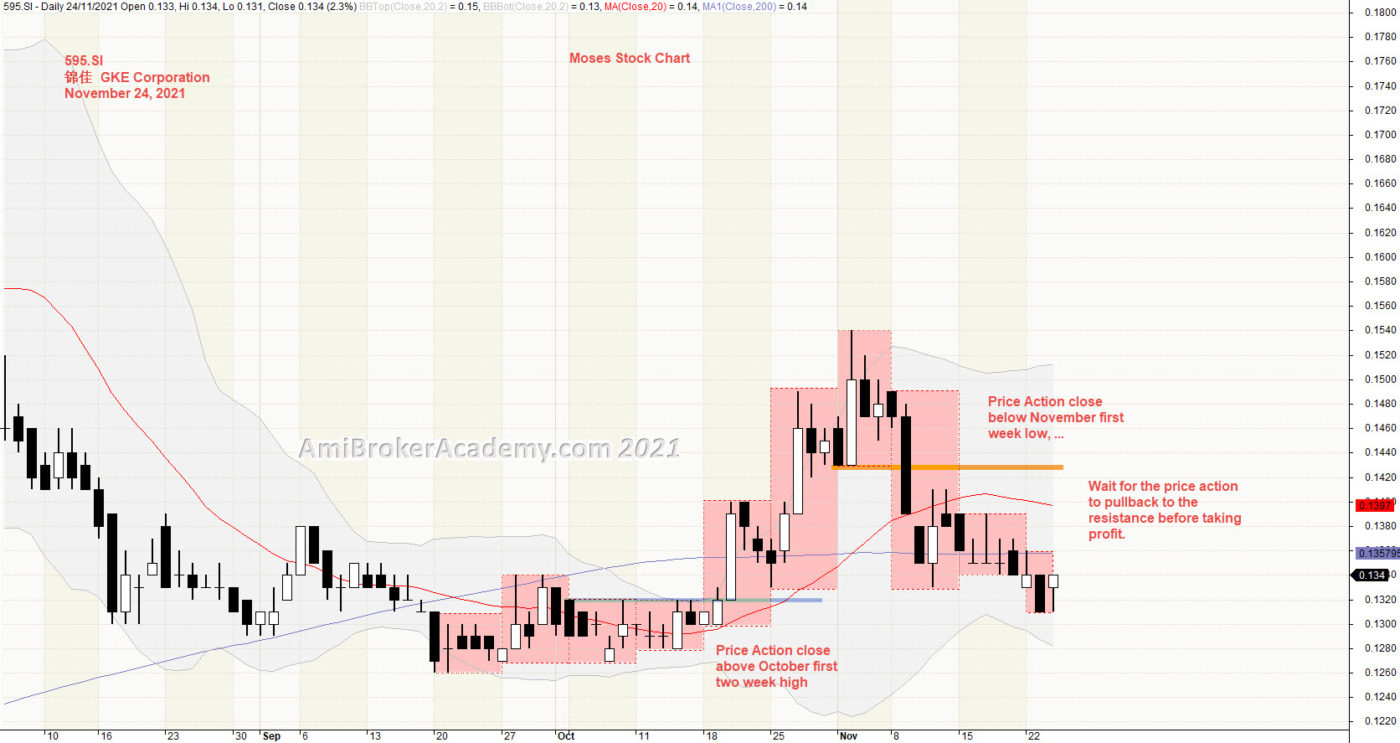
1) GKE Corp and Week High Low
Picture worth a thousand words. Price Action is retrace below November first week low and stay below. Price Action draw near the October first and second week high. Resistance turns support?? Will see.
See chart.
Can Price Action continues to go lower? May be.
If you are a buy and hold strategist, Will you sell now? Remember only buy near support,or sell resistance. Wait for the price action near the resistance before sell.
20211124 GKE Corp Week High Low
Moses Power Charting
Official AmiBrokerAcademy.com Charting
Disclaimer
The above result is for illustration purpose. It is meant to be used for learning buy or sell signals. We do not recommend for any particular stocks. If particular stocks of such are mentioned, they are meant as a demonstration of Amibroker as a powerful charting software. Amibroker is a charting software, it can program to scan the stocks for buy and sell signals. Or backtest for any trading strategy or technique.
We post script generated signals. Not all scan results are shown here depending on selection criterial. The MACD signal should use with price action. Users must understand what MACD and price action are all about before using them. If necessary you should attend a course to learn more on Technical Analysis (TA) and Moving Average Convergence Divergence, MACD.
Once again, the website does not guarantee any results or investment return based on the information and instruction you have read here. It should be used as learning aids only and if you decide to trade real money, all trading decision should be your own.
We learn from many past and present great traders. Kudo to these master.