Welcome to AmiBroker Academy dot com, amibrokeracademy.com.
If There is Only One Chart This is It
This is not a site that provides buy or sell signals directly. We read the stock chart bar by bar. If you understand what we read, you will get the buy or sell idea. Have fun!
Buy or Sell, you decide
Trading is very simple yet very difficult. Price is either up or down. But catch the right move is not easy. I believe many must have missed the falling knife. Now, many will be watching the topping. Can any catch the topping? Will see.
Up Down or Sideways
Trading is all probability. The price action is either up, down or sideways.
Trade what you see. Manage your risk.
Our Believe – Buy Support Sell Resistance.
1) Bitcoin Crypto and MACD Divergence
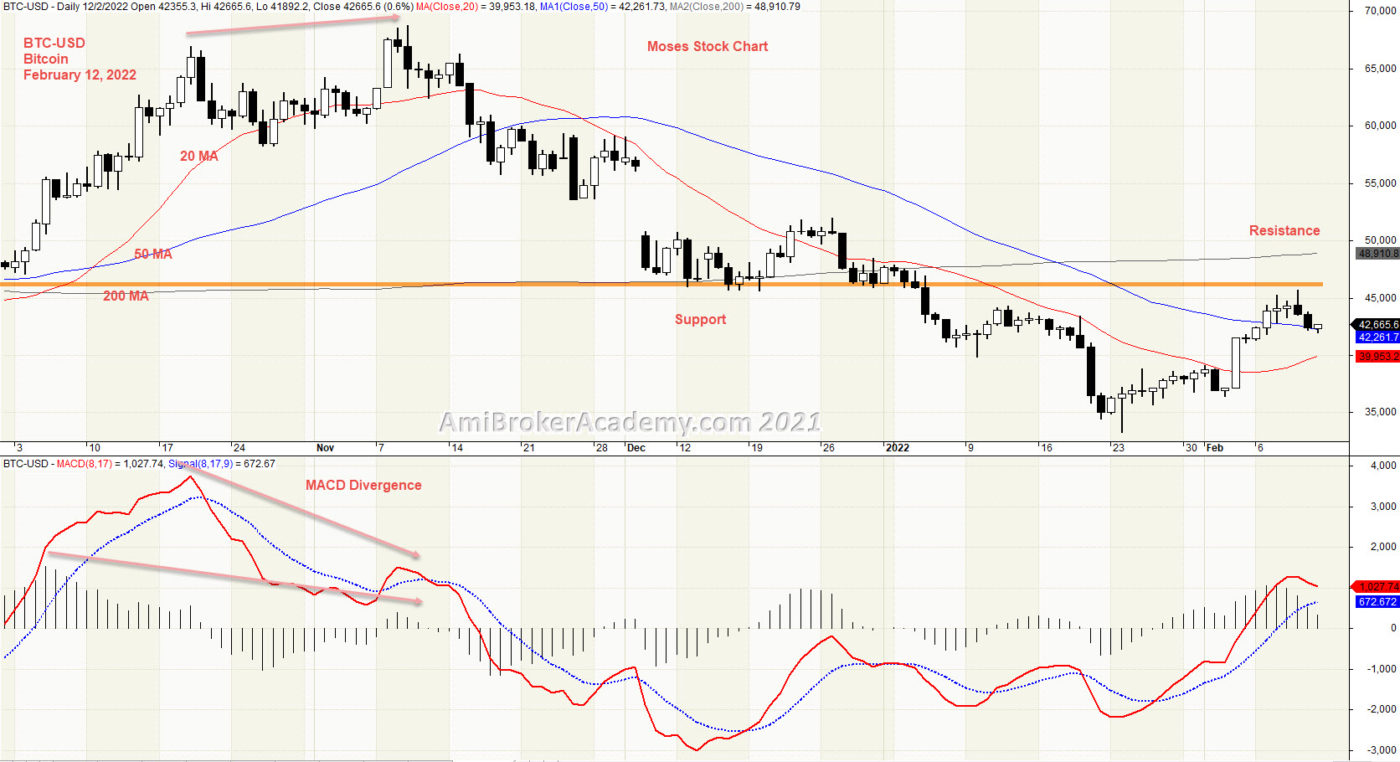
Picture worth a thousand words. MACD shows a divergence, when price action forms a higher high, but MACD forms a lower high. This indicates the price action starting to become weaker.
When you spot a MACD Divergence, it is wise to monitor the the price action pullback. So, if the price action begin to close below the trendline, it is a good idea to take some profit, in other words the money on the table.
See chart. Price Action did close below the support. Now the price action is resisted by the support turns resistance.
If you are a buy and hold strategist, Will you sell now or buy now? Remember only buy near support, and sell near resistance. Wait for the price action draw near either resistance or support before action.
20220212 Bitcoin Crypto and MACD Divergence
Moses Power Charting
Official AmiBrokerAcademy.com Charting
Disclaimer
The above result is for illustration purpose. It is meant to be used for learning buy or sell signals. We do not recommend for any particular stocks. If particular stocks of such are mentioned, they are meant as a demonstration of Amibroker as a powerful charting software. Amibroker is a charting software, it can program to scan the stocks for buy and sell signals. Or backtest for any trading strategy or technique.
We post script generated signals. Not all scan results are shown here depending on selection criterial. The MACD signal should use with price action. Users must understand what MACD and price action are all about before using them. If necessary you should attend a course to learn more on Technical Analysis (TA) and Moving Average Convergence Divergence, MACD.
Once again, the website does not guarantee any results or investment return based on the information and instruction you have read here. It should be used as learning aids only and if you decide to trade real money, all trading decision should be your own.
We learn from many past and present great traders. Kudo to these master.
Welcome to AmiBroker Academy dot com, amibrokeracademy.com.
If There is Only One Chart This is It
This is not a site that provides buy or sell signals directly. We read the stock chart bar by bar. If you understand what we read, you will get the buy or sell idea. Have fun!
Buy or Sell, you decide
Trading is very simple yet very difficult. Price is either up or down. But catch the right move is not easy. I believe many must have missed the falling knife. Now, many will be watching the topping. Can any catch the topping? Will see.
Up Down or Sideways
Trading is all probability. The price action is either up, down or sideways.
Trade what you see. Manage your risk.
Our Believe – Buy Support Sell Resistance.
1) Straits Times Index Month High Low
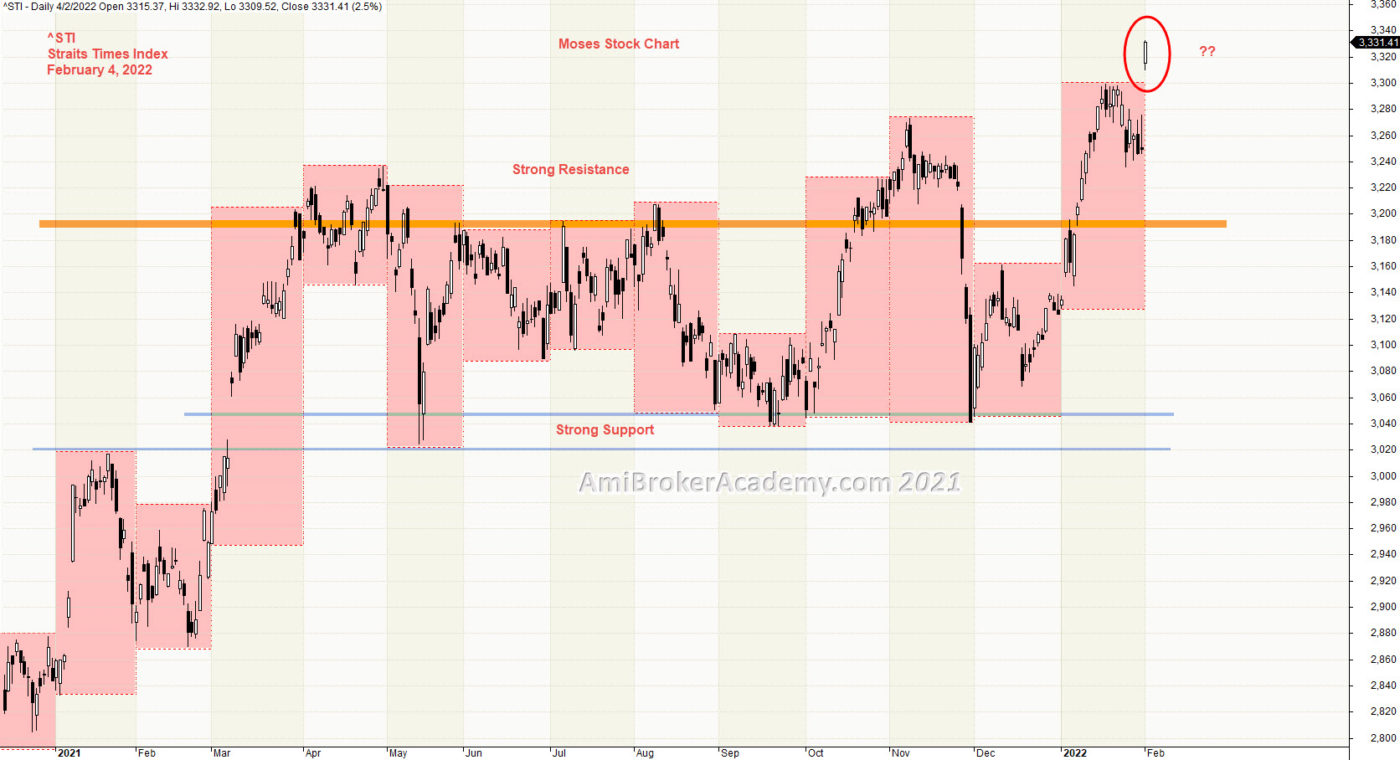
Picture worth a thousand words. In our last analysis, Price Action was stay below 3280 level. 3000, 3300 seems to be strong level. But, from 17 last month, the price action start to close above 3280.
And on the start of this month, price action has gap up and close above 3300 level.
See chart.
If you are a buy and hold strategist, Will you sell now or buy now? Remember only buy near support, and sell near resistance. Wait for the price action draw near either resistance or support before action.
Moses Power Charting
Official AmiBrokerAcademy.com Charting
Disclaimer
The above result is for illustration purpose. It is meant to be used for learning buy or sell signals. We do not recommend for any particular stocks. If particular stocks of such are mentioned, they are meant as a demonstration of Amibroker as a powerful charting software. Amibroker is a charting software, it can program to scan the stocks for buy and sell signals. Or backtest for any trading strategy or technique.
We post script generated signals. Not all scan results are shown here depending on selection criterial. The MACD signal should use with price action. Users must understand what MACD and price action are all about before using them. If necessary you should attend a course to learn more on Technical Analysis (TA) and Moving Average Convergence Divergence, MACD.
Once again, the website does not guarantee any results or investment return based on the information and instruction you have read here. It should be used as learning aids only and if you decide to trade real money, all trading decision should be your own.
We learn from many past and present great traders. Kudo to these master.
Welcome to AmiBroker Academy dot com, amibrokeracademy.com.
If There is Only One Chart This is It
This is not a site that provides buy or sell signals directly. We read the stock chart bar by bar. If you understand what we read, you will get the buy or sell idea. Have fun!
Buy or Sell, you decide
Trading is very simple yet very difficult. Price is either up or down. But catch the right move is not easy. I believe many must have missed the falling knife. Now, many will be watching the topping. Can any catch the topping? Will see.
Up Down or Sideways
Trading is all probability. The price action is either up, down or sideways.
Trade what you see. Manage your risk.
Our Believe – Buy Support Sell Resistance.
1) Straits Times Index Week High Low
Picture worth a thousand words. Price Action seems stay below 3280 level. 3000, 3300 seems to be strong level, can not breakout above. From the week high low, price action may have chance to test and breakout above 3300 level. Watch the space here.
3000 level is a very strong level, 3300 level even stronger. Be very mindful for the next few months trading.
See chart.
If you are a buy and hold strategist, Will you sell now or buy now? Remember only buy near support, and sell near resistance. Wait for the price action draw near either resistance or support before action.
20220110 Straits Times Index and Week High Low
Moses Power Charting
Official AmiBrokerAcademy.com Charting
Disclaimer
The above result is for illustration purpose. It is meant to be used for learning buy or sell signals. We do not recommend for any particular stocks. If particular stocks of such are mentioned, they are meant as a demonstration of Amibroker as a powerful charting software. Amibroker is a charting software, it can program to scan the stocks for buy and sell signals. Or backtest for any trading strategy or technique.
We post script generated signals. Not all scan results are shown here depending on selection criterial. The MACD signal should use with price action. Users must understand what MACD and price action are all about before using them. If necessary you should attend a course to learn more on Technical Analysis (TA) and Moving Average Convergence Divergence, MACD.
Once again, the website does not guarantee any results or investment return based on the information and instruction you have read here. It should be used as learning aids only and if you decide to trade real money, all trading decision should be your own.
We learn from many past and present great traders. Kudo to these master.
Welcome to AmiBroker Academy dot com, amibrokeracademy.com.
If There is Only One Chart This is It
This is not a site that provides buy or sell signals directly. We read the stock chart bar by bar. If you understand what we read, you will get the buy or sell idea. Have fun!
Buy or Sell, you decide
Trading is very simple yet very difficult. Price is either up or down. But catch the right move is not easy. I believe many must have missed the falling knife. Now, many will be watching the topping. Can any catch the topping? Will see.
Up Down or Sideways
Trading is all probability. The price action is either up, down or sideways.
Trade what you see. Manage your risk.
Our Believe – Buy Support Sell Resistance.
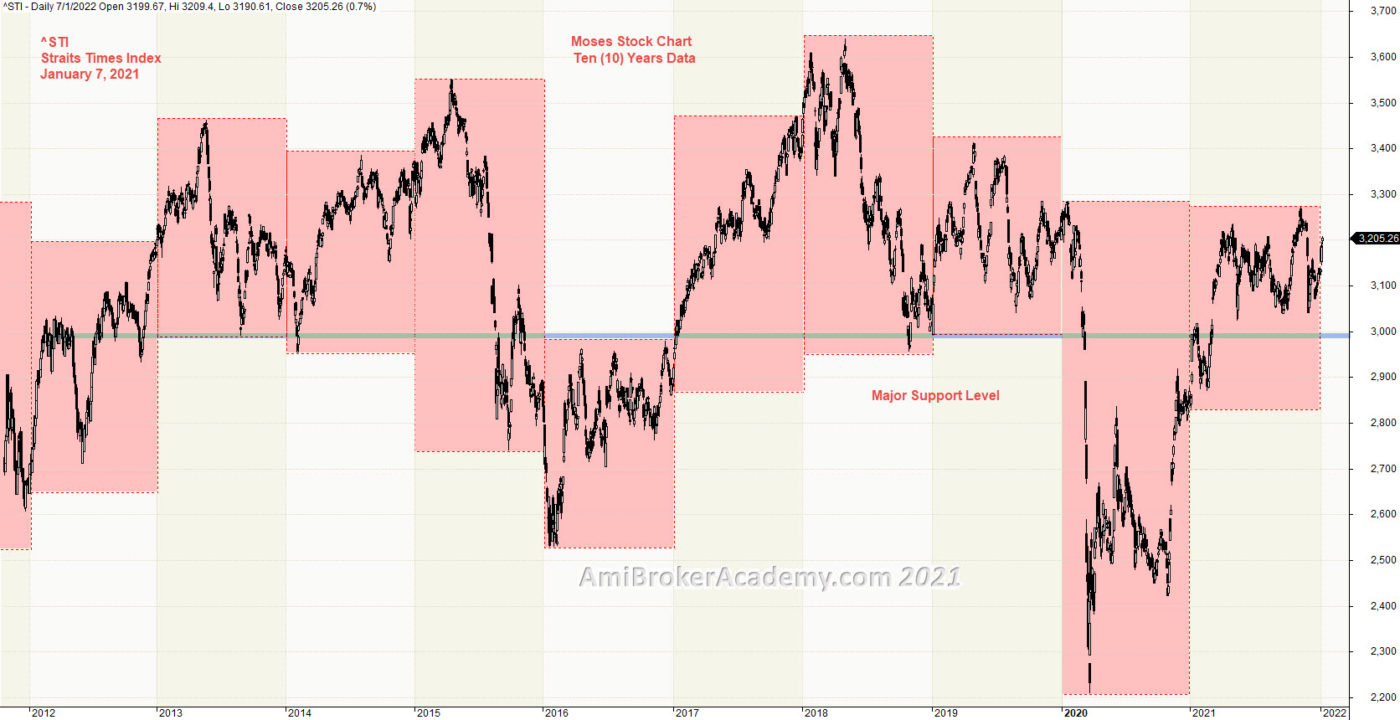
1) Straits Times Index Ten Years Data
Picture worth a thousand words. Price Action seems stay above the support at last. Price Action can not breakout higher than the 3300 level. 3300 level must be a very strong level. Maybe the price action will continues to test 3300 level in 2022.
3000 level is a very strong level, see chart the blue line. There were at least five years stay above the 3000 level.
See chart.
If you are a buy and hold strategist, Will you sell now or buy now? Remember only buy near support, and sell near resistance. Wait for the price action draw near either resistance or support before action.
20220107 Straits Times Index Ten Years Data
Moses Power Charting
Official AmiBrokerAcademy.com Charting
Disclaimer
The above result is for illustration purpose. It is meant to be used for learning buy or sell signals. We do not recommend for any particular stocks. If particular stocks of such are mentioned, they are meant as a demonstration of Amibroker as a powerful charting software. Amibroker is a charting software, it can program to scan the stocks for buy and sell signals. Or backtest for any trading strategy or technique.
We post script generated signals. Not all scan results are shown here depending on selection criterial. The MACD signal should use with price action. Users must understand what MACD and price action are all about before using them. If necessary you should attend a course to learn more on Technical Analysis (TA) and Moving Average Convergence Divergence, MACD.
Once again, the website does not guarantee any results or investment return based on the information and instruction you have read here. It should be used as learning aids only and if you decide to trade real money, all trading decision should be your own.
We learn from many past and present great traders. Kudo to these master.
Welcome to AmiBroker Academy dot com, amibrokeracademy.com.
If There is Only One Chart This is It
This is not a site that provides buy or sell signals directly. We read the stock chart bar by bar. If you understand what we read, you will get the buy or sell idea. Have fun!
Buy or Sell, you decide
Trading is very simple yet very difficult. Price is either up or down. But catch the right move is not easy. I believe many must have missed the falling knife. Now, many will be watching the topping. Can any catch the topping? Will see.
Up Down or Sideways
Trading is all probability. The price action is either up, down or sideways.
Trade what you see. Manage your risk.
Our Believe – Buy Support Sell Resistance.
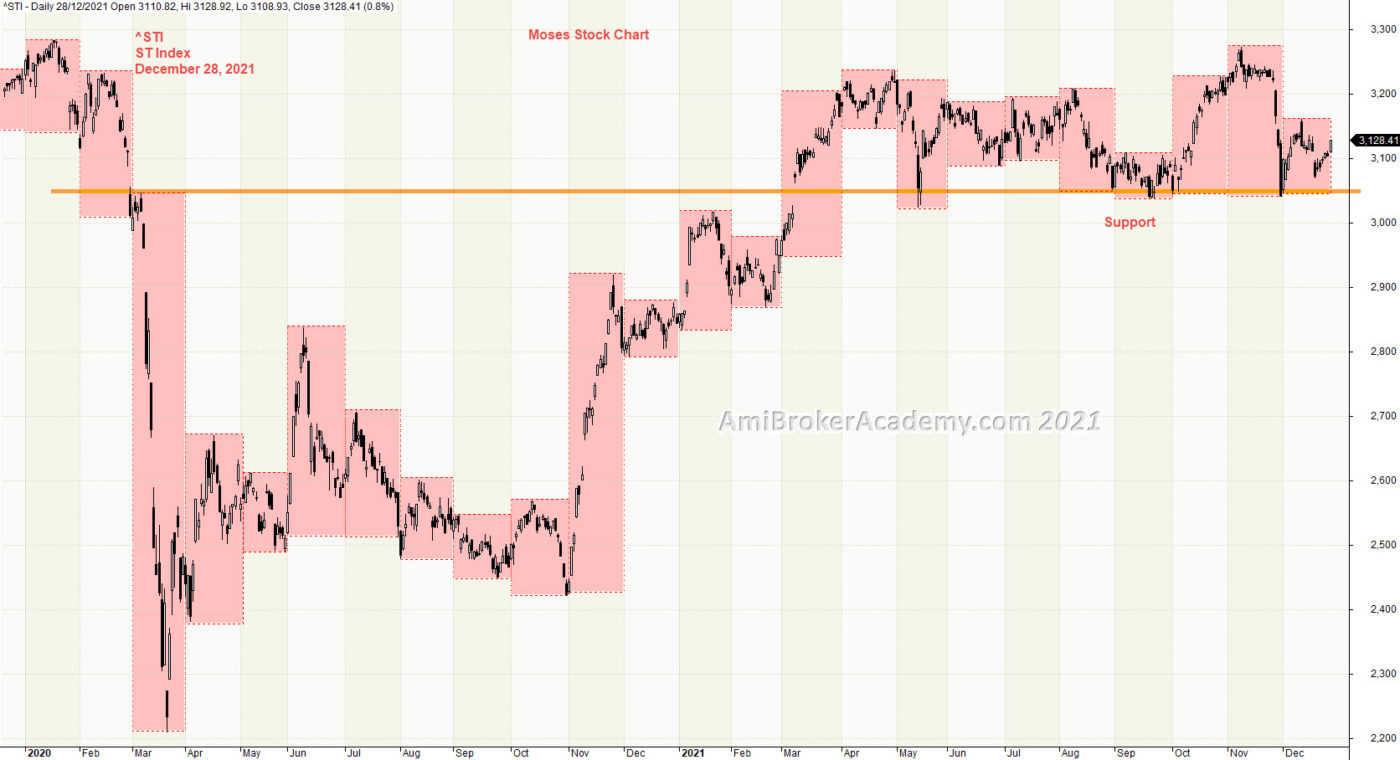
1) Straits Times Index Month High Low from 2020
Picture worth a thousand words. Price Action seems stay above the support. Price Action can not breakout higher than the 3300 level. 3300 level must be a very strong level. Maybe the price action will continues to test 3300 level.
See chart.
If you are a buy and hold strategist, Will you sell now or buy now? Remember only buy near support, and sell near resistance. Wait for the price action draw near either resistance or support before action.
20211228 Straits Times Index Month High Low from 2020
Moses Power Charting
Official AmiBrokerAcademy.com Charting
Disclaimer
The above result is for illustration purpose. It is meant to be used for learning buy or sell signals. We do not recommend for any particular stocks. If particular stocks of such are mentioned, they are meant as a demonstration of Amibroker as a powerful charting software. Amibroker is a charting software, it can program to scan the stocks for buy and sell signals. Or backtest for any trading strategy or technique.
We post script generated signals. Not all scan results are shown here depending on selection criterial. The MACD signal should use with price action. Users must understand what MACD and price action are all about before using them. If necessary you should attend a course to learn more on Technical Analysis (TA) and Moving Average Convergence Divergence, MACD.
Once again, the website does not guarantee any results or investment return based on the information and instruction you have read here. It should be used as learning aids only and if you decide to trade real money, all trading decision should be your own.
We learn from many past and present great traders. Kudo to these master.
Welcome to AmiBroker Academy dot com, amibrokeracademy.com.
If There is Only One Chart This is It
This is not a site that provides buy or sell signals directly. We read the stock chart bar by bar. If you understand what we read, you will get the buy or sell idea. Have fun!
Buy or Sell, you decide
Trading is very simple yet very difficult. Price is either up or down. But catch the right move is not easy. I believe many must have missed the falling knife. Now, many will be watching the topping. Can any catch the topping? Will see.
Up Down or Sideways
Trading is all probability. The price action is either up, down or sideways.
Trade what you see. Manage your risk.
Our Believe – Buy Support Sell Resistance.
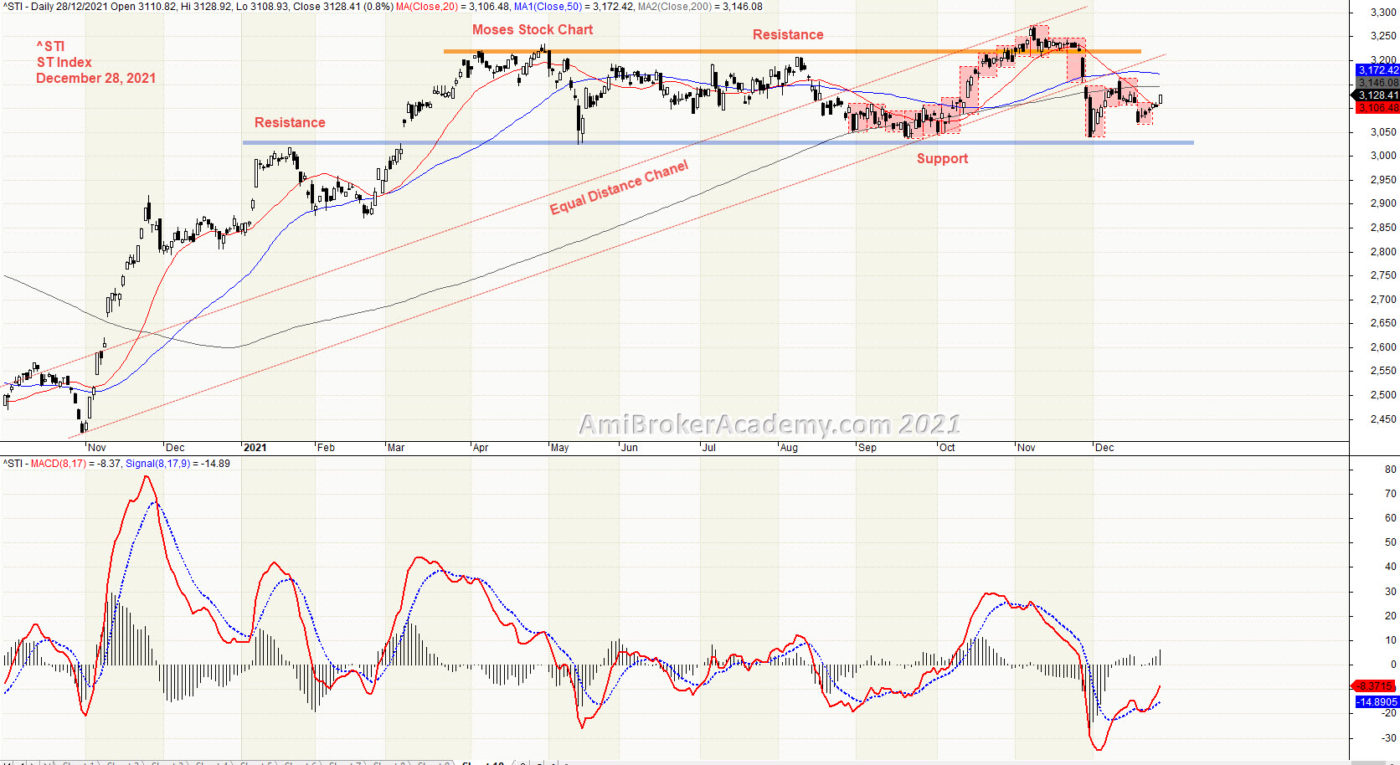
1) Straits Times Index and MACD Last Thirteen Months
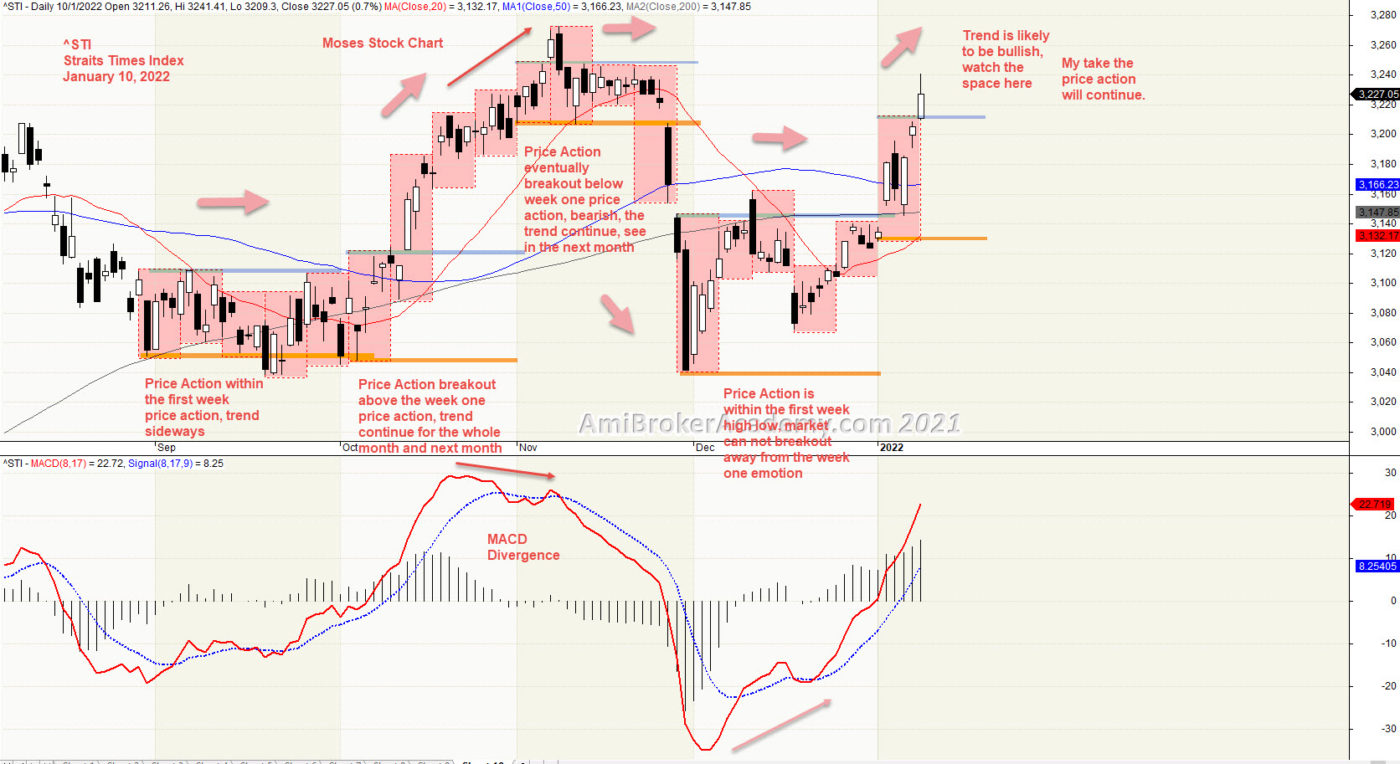
Picture worth a thousand words. Zoom out, see a bigger picture. Price Action is resisted by the resistance from April, price action is also supported. Price Action is trapped within an equal distance channel. See chart. Price Action breakout from the resistance in the beginning of the year, resistance turns support. You can also say the price action move in sideways from March.
Price Action moves from low in October last year, the price action forms higher high and test the 3250 level. Can the price action continues to go higher. Will see.
See chart.
If you are a buy and hold strategist, Will you sell now or buy now? Remember only buy near support, and sell near resistance. Wait for the price action draw near either resistance or support before action.
20211228 Straits Times Index and MACD last Thirteen Months
Moses Power Charting
Official AmiBrokerAcademy.com Charting
Disclaimer
The above result is for illustration purpose. It is meant to be used for learning buy or sell signals. We do not recommend for any particular stocks. If particular stocks of such are mentioned, they are meant as a demonstration of Amibroker as a powerful charting software. Amibroker is a charting software, it can program to scan the stocks for buy and sell signals. Or backtest for any trading strategy or technique.
We post script generated signals. Not all scan results are shown here depending on selection criterial. The MACD signal should use with price action. Users must understand what MACD and price action are all about before using them. If necessary you should attend a course to learn more on Technical Analysis (TA) and Moving Average Convergence Divergence, MACD.
Once again, the website does not guarantee any results or investment return based on the information and instruction you have read here. It should be used as learning aids only and if you decide to trade real money, all trading decision should be your own.
We learn from many past and present great traders. Kudo to these master.
Welcome to AmiBroker Academy dot com, amibrokeracademy.com.
If There is Only One Chart This is It
This is not a site that provides buy or sell signals directly. We read the stock chart bar by bar. If you understand what we read, you will get the buy or sell idea. Have fun!
Buy or Sell, you decide
Trading is very simple yet very difficult. Price is either up or down. But catch the right move is not easy. I believe many must have missed the falling knife. Now, many will be watching the topping. Can any catch the topping? Will see.
Up Down or Sideways
Trading is all probability. The price action is either up, down or sideways.
Trade what you see. Manage your risk.
Our Believe – Buy Support Sell Resistance.
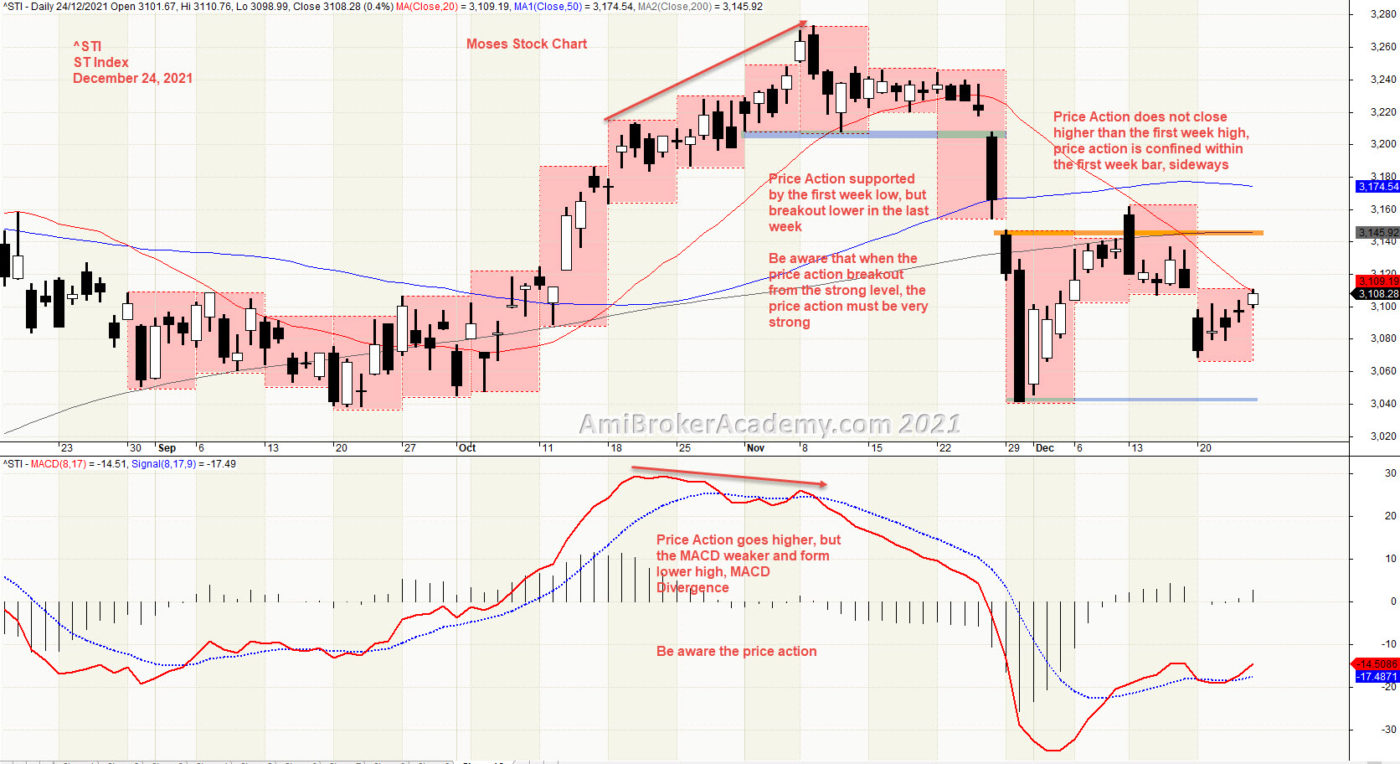
1) Straits Times Index and week high low
Picture worth a thousand words. Price Action seems sideways on the December, as price action is contained within the first week high low, see chart. Price Action moves higher in the October, but the MACD forms lower high; MACD Divergence. When such pattern happened, there is a potential that the price action may pullback and goes lower. True enough that the price action close below November first week low on the last week. Thereafter, as we describe at the start the price action deep down and sideways.
See chart.
If you are a buy and hold strategist, Will you sell now or buy now? Remember only buy near support, and sell near resistance. Wait for the price action draw near either resistance or support before action.
20211224 Straits Times Index and week high low
Moses Power Charting
Official AmiBrokerAcademy.com Charting
Disclaimer
The above result is for illustration purpose. It is meant to be used for learning buy or sell signals. We do not recommend for any particular stocks. If particular stocks of such are mentioned, they are meant as a demonstration of Amibroker as a powerful charting software. Amibroker is a charting software, it can program to scan the stocks for buy and sell signals. Or backtest for any trading strategy or technique.
We post script generated signals. Not all scan results are shown here depending on selection criterial. The MACD signal should use with price action. Users must understand what MACD and price action are all about before using them. If necessary you should attend a course to learn more on Technical Analysis (TA) and Moving Average Convergence Divergence, MACD.
Once again, the website does not guarantee any results or investment return based on the information and instruction you have read here. It should be used as learning aids only and if you decide to trade real money, all trading decision should be your own.
We learn from many past and present great traders. Kudo to these master.
Welcome to AmiBroker Academy dot com, amibrokeracademy.com.
If There is Only One Chart This is It
This is not a site that provides buy or sell signals directly. We read the stock chart bar by bar. If you understand what we read, you will get the buy or sell idea. Have fun!
Buy or Sell, you decide
Trading is very simple yet very difficult. Price is either up or down. But catch the right move is not easy. I believe many must have missed the falling knife. Now, many will be watching the topping. Can any catch the topping? Will see.
Up Down or Sideways
Trading is all probability. The price action is either up, down or sideways.
Trade what you see. Manage your risk.
Our Believe – Buy Support Sell Resistance.
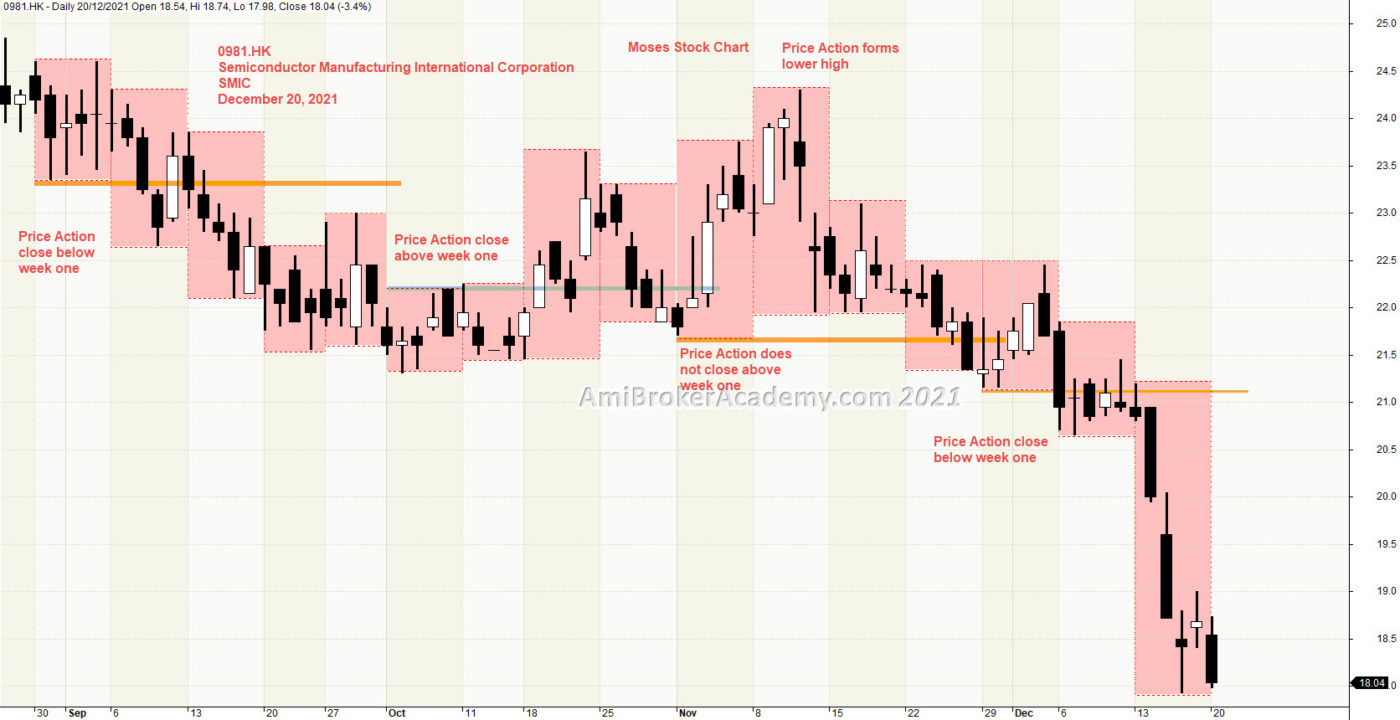
1) Semiconductor Manufacturing International Corporation SMIC Week High Low
Picture worth a thousand words. Price Action close below September week one low. Next, price action close above October week one high. Price Action move sideways in November. For December, price action goes lower, price action close below week one.
Will see.
See chart.
If you are a buy and hold strategist, Will you sell now or buy now? Remember only buy near support, and sell near resistance. Wait for the price action draw near either resistance or support before action.
20211220 Semiconductor Manufacturing International Corporation SMIC Week High Low
Moses Power Charting
Official AmiBrokerAcademy.com Charting
Disclaimer
The above result is for illustration purpose. It is meant to be used for learning buy or sell signals. We do not recommend for any particular stocks. If particular stocks of such are mentioned, they are meant as a demonstration of Amibroker as a powerful charting software. Amibroker is a charting software, it can program to scan the stocks for buy and sell signals. Or backtest for any trading strategy or technique.
We post script generated signals. Not all scan results are shown here depending on selection criterial. The MACD signal should use with price action. Users must understand what MACD and price action are all about before using them. If necessary you should attend a course to learn more on Technical Analysis (TA) and Moving Average Convergence Divergence, MACD.
Once again, the website does not guarantee any results or investment return based on the information and instruction you have read here. It should be used as learning aids only and if you decide to trade real money, all trading decision should be your own.
We learn from many past and present great traders. Kudo to these master.
Welcome to AmiBroker Academy dot com, amibrokeracademy.com.
If There is Only One Chart This is It
This is not a site that provides buy or sell signals directly. We read the stock chart bar by bar. If you understand what we read, you will get the buy or sell idea. Have fun!
Buy or Sell, you decide
Trading is very simple yet very difficult. Price is either up or down. But catch the right move is not easy. I believe many must have missed the falling knife. Now, many will be watching the topping. Can any catch the topping? Will see.
Up Down or Sideways
Trading is all probability. The price action is either up, down or sideways.
Trade what you see. Manage your risk.
Our Believe – Buy Support Sell Resistance.
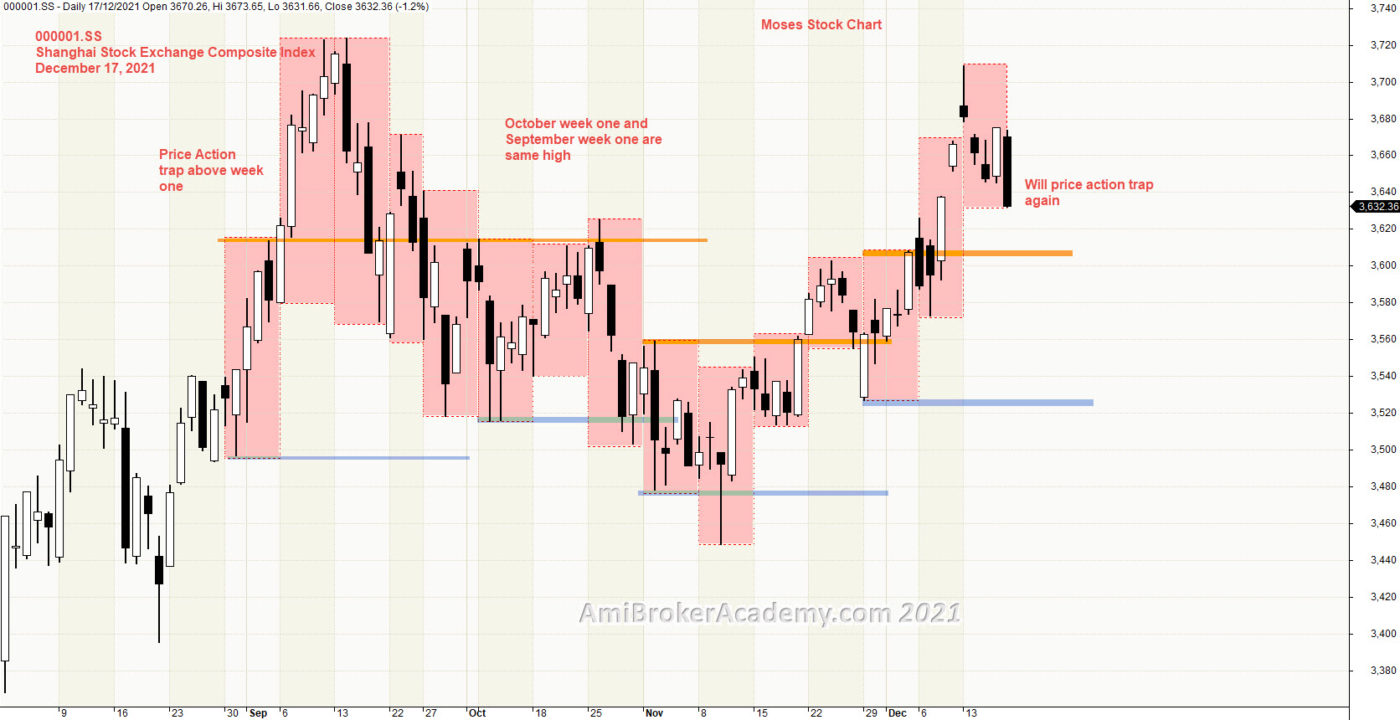
1) Shanghai Stock Exchange Composite Index 上证综指 and Week High Low
Picture worth a thousand words. October week one high and September week one high are the same. Price Action trapped after bull rush. Now December spike again after week one. Bull trap again?
Will see.
See chart.
If you are a buy and hold strategist, Will you sell now or buy now? Remember only buy near support, and sell near resistance. Wait for the price action draw near either resistance or support before action.
20211217 Shanghai Stock Exchange Composite Index 上证综指 and Week High Low
Moses Power Charting
Official AmiBrokerAcademy.com Charting
Disclaimer
The above result is for illustration purpose. It is meant to be used for learning buy or sell signals. We do not recommend for any particular stocks. If particular stocks of such are mentioned, they are meant as a demonstration of Amibroker as a powerful charting software. Amibroker is a charting software, it can program to scan the stocks for buy and sell signals. Or backtest for any trading strategy or technique.
We post script generated signals. Not all scan results are shown here depending on selection criterial. The MACD signal should use with price action. Users must understand what MACD and price action are all about before using them. If necessary you should attend a course to learn more on Technical Analysis (TA) and Moving Average Convergence Divergence, MACD.
Once again, the website does not guarantee any results or investment return based on the information and instruction you have read here. It should be used as learning aids only and if you decide to trade real money, all trading decision should be your own.
We learn from many past and present great traders. Kudo to these master.
Welcome to AmiBroker Academy dot com, amibrokeracademy.com.
If There is Only One Chart This is It
This is not a site that provides buy or sell signals directly. We read the stock chart bar by bar. If you understand what we read, you will get the buy or sell idea. Have fun!
Buy or Sell, you decide
Trading is very simple yet very difficult. Price is either up or down. But catch the right move is not easy. I believe many must have missed the falling knife. Now, many will be watching the topping. Can any catch the topping? Will see.
Up Down or Sideways
Trading is all probability. The price action is either up, down or sideways.
Trade what you see. Manage your risk.
Our Believe – Buy Support Sell Resistance.
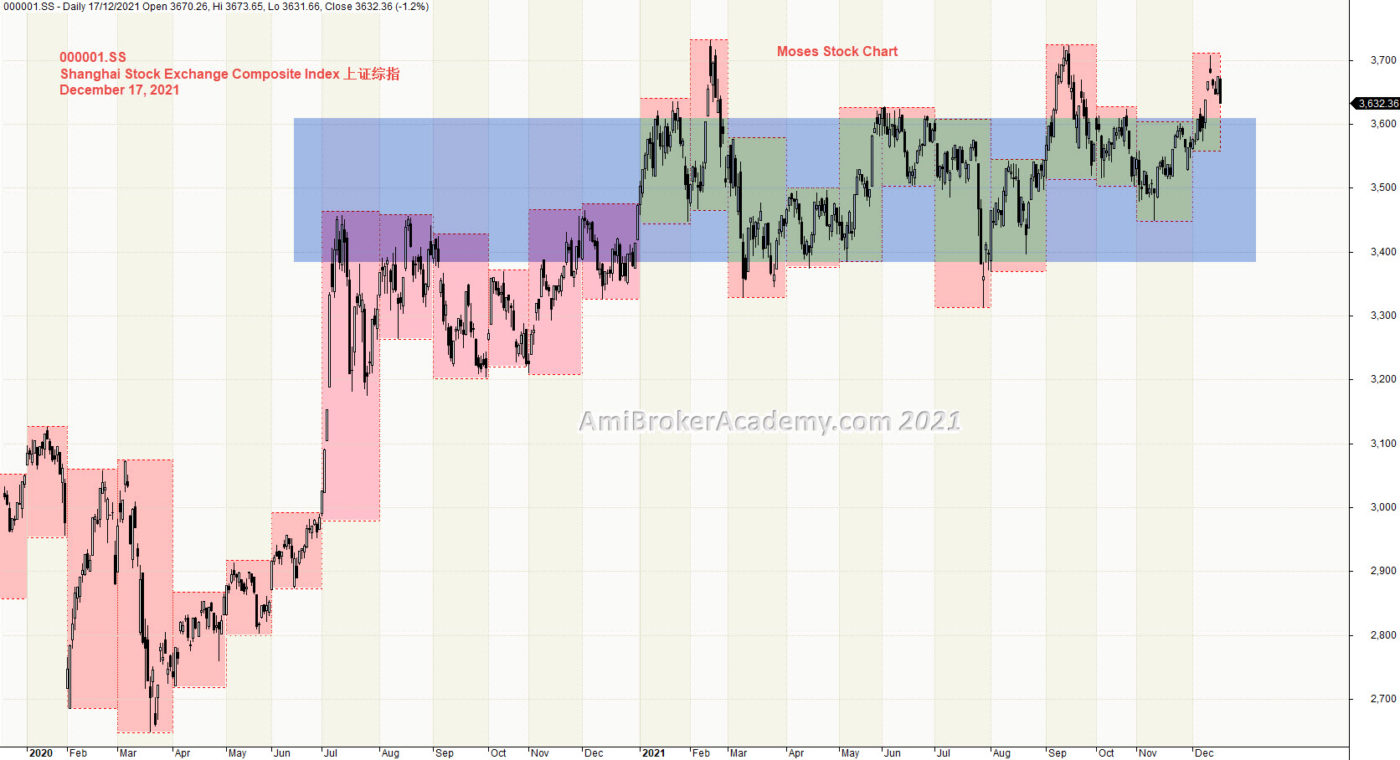
1) Shanghai Stock Exchange Composite Index 上证综指 and Month High Low
Picture worth a thousand words. Support Resistance is the basic of trading, we buy support and sell resistance. If you could identify a good support or resistance level, chances is you can reduce your trading risk. We look back for last twenty four months of price action. We could see there were at least two major bull traps. We see the price action goes sideways.
A third bull trap might be in progress. Will see.
See chart.
If you are a buy and hold strategist, Will you sell now or buy now? Remember only buy near support, and sell near resistance. Wait for the price action draw near either resistance or support before action.
20211217 Shanghai Stock Exchange Composite Index 上证综指 and Month High Low
Moses Power Charting
Official AmiBrokerAcademy.com Charting
Disclaimer
The above result is for illustration purpose. It is meant to be used for learning buy or sell signals. We do not recommend for any particular stocks. If particular stocks of such are mentioned, they are meant as a demonstration of Amibroker as a powerful charting software. Amibroker is a charting software, it can program to scan the stocks for buy and sell signals. Or backtest for any trading strategy or technique.
We post script generated signals. Not all scan results are shown here depending on selection criterial. The MACD signal should use with price action. Users must understand what MACD and price action are all about before using them. If necessary you should attend a course to learn more on Technical Analysis (TA) and Moving Average Convergence Divergence, MACD.
Once again, the website does not guarantee any results or investment return based on the information and instruction you have read here. It should be used as learning aids only and if you decide to trade real money, all trading decision should be your own.
We learn from many past and present great traders. Kudo to these master.
Welcome to AmiBroker Academy dot com, amibrokeracademy.com.
If There is Only One Chart This is It
This is not a site that provides buy or sell signals directly. We read the stock chart bar by bar. If you understand what we read, you will get the buy or sell idea. Have fun!
Buy or Sell, you decide
Trading is very simple yet very difficult. Price is either up or down. But catch the right move is not easy. I believe many must have missed the falling knife. Now, many will be watching the topping. Can any catch the topping? Will see.
Up Down or Sideways
Trading is all probability. The price action is either up, down or sideways.
Trade what you see. Manage your risk.
Our Believe – Buy Support Sell Resistance.
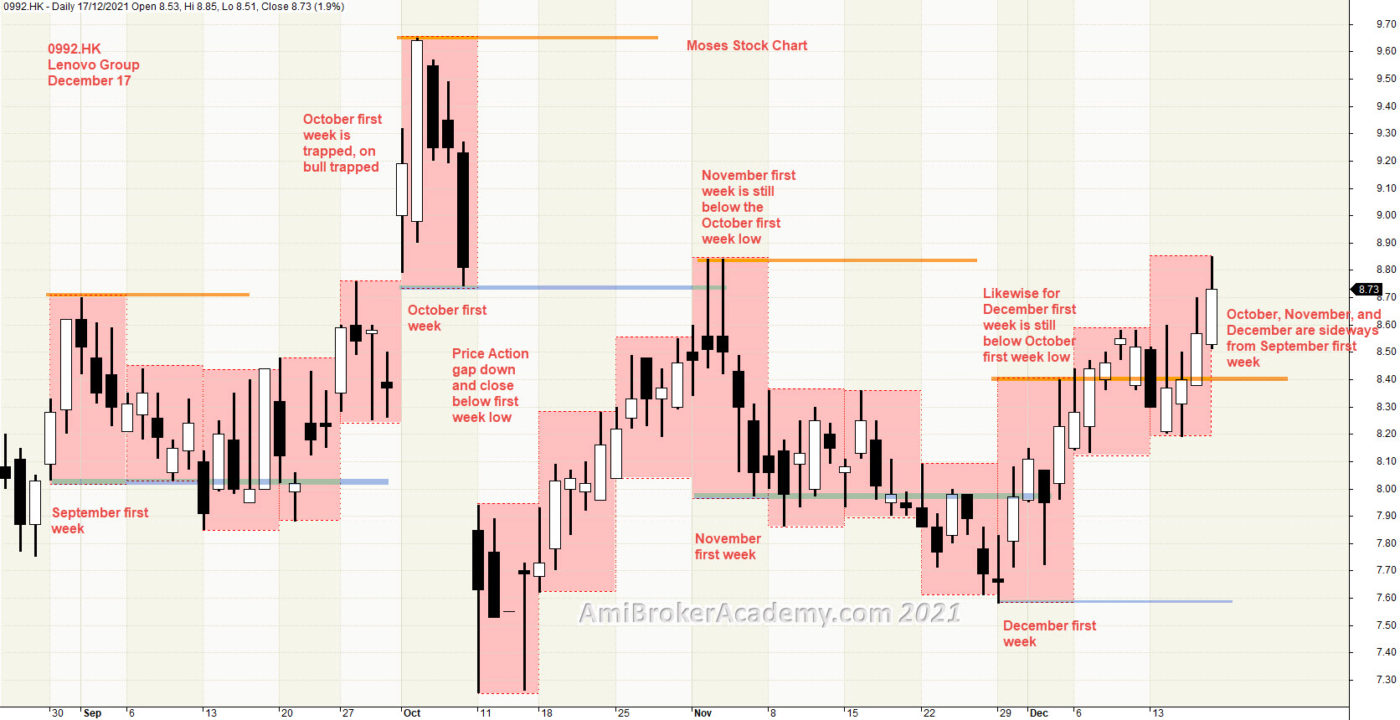
1) Lenovo Group Week High Low
Picture worth a thousand words. Support Resistance is the basic of trading, we buy support and sell resistance. If you could identify a good support resistance level, chances is you can reduce the trading risk. We study the Lenovo stock chart weekly high low, we see the price action could in a bull trap in October week one, thereafter the price action is on sideways. Price action has a gap down in October on the second week. price action close below the October week one.
We could easily identify a bull ABCD pattern, after the gap down.
See chart.
If you are a buy and hold strategist, Will you sell now or buy now? Remember only buy near support, and sell near resistance. Wait for the price action draw near either resistance or support before action.
20211217 Lenovo Group Week High Low
Moses Power Charting
Official AmiBrokerAcademy.com Charting
Disclaimer
The above result is for illustration purpose. It is meant to be used for learning buy or sell signals. We do not recommend for any particular stocks. If particular stocks of such are mentioned, they are meant as a demonstration of Amibroker as a powerful charting software. Amibroker is a charting software, it can program to scan the stocks for buy and sell signals. Or backtest for any trading strategy or technique.
We post script generated signals. Not all scan results are shown here depending on selection criterial. The MACD signal should use with price action. Users must understand what MACD and price action are all about before using them. If necessary you should attend a course to learn more on Technical Analysis (TA) and Moving Average Convergence Divergence, MACD.
Once again, the website does not guarantee any results or investment return based on the information and instruction you have read here. It should be used as learning aids only and if you decide to trade real money, all trading decision should be your own.
We learn from many past and present great traders. Kudo to these master.
Welcome to AmiBroker Academy dot com, amibrokeracademy.com.
If There is Only One Chart This is It
This is not a site that provides buy or sell signals directly. We read the stock chart bar by bar. If you understand what we read, you will get the buy or sell idea. Have fun!
Buy or Sell, you decide
Trading is very simple yet very difficult. Price is either up or down. But catch the right move is not easy. I believe many must have missed the falling knife. Now, many will be watching the topping. Can any catch the topping? Will see.
Up Down or Sideways
Trading is all probability. The price action is either up, down or sideways.
Trade what you see. Manage your risk.
Our Believe – Buy Support Sell Resistance.
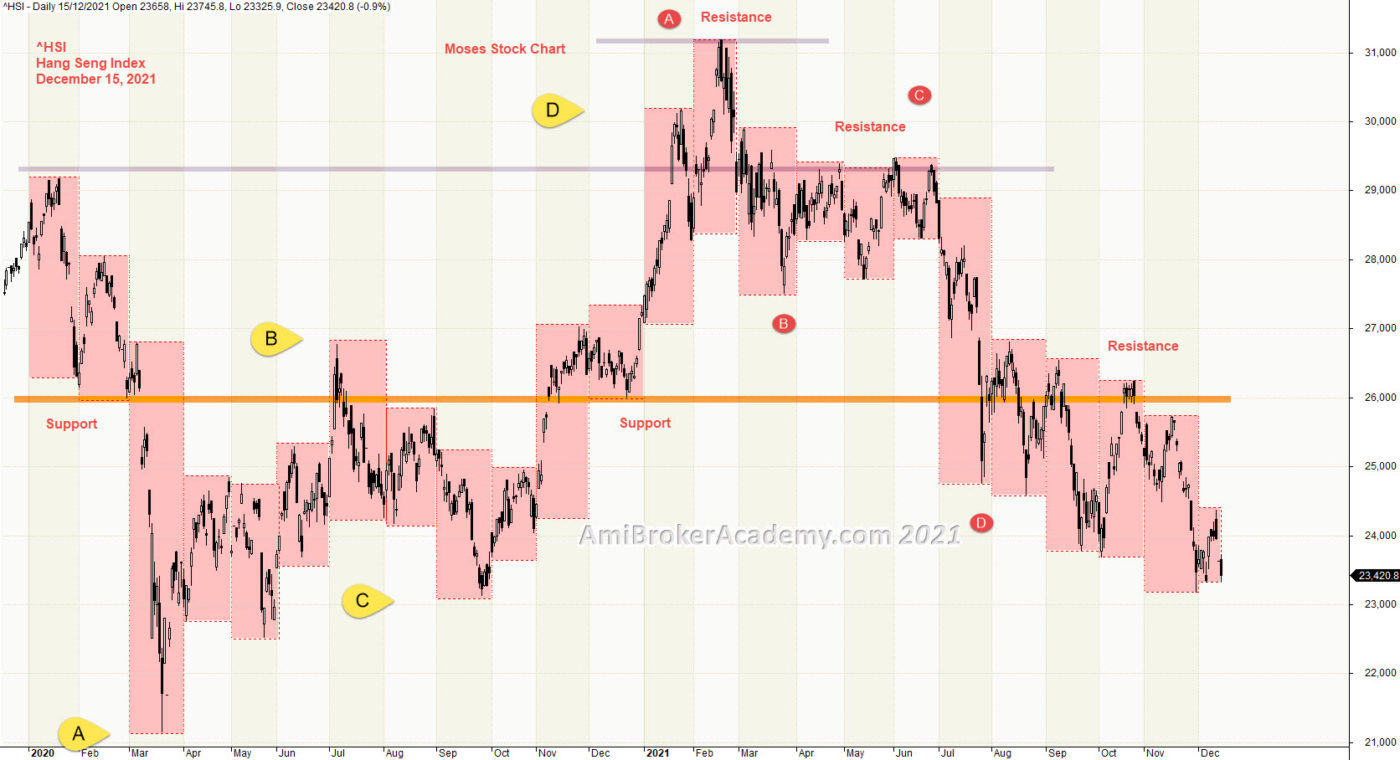
1) Hang Seng Index and Month High Low
Picture worth a thousand words. Support Resistance is the basic of trading, we buy support and sell resistance. If you could identify a good support resistance level, chances is you can buy at the right level and taking profit at a right levell too.
We could easily identify a few ABCD pattern, and support resistance level.
See chart.
If you are a buy and hold strategist, Will you sell now or buy now? Remember only buy near support, and sell near resistance. Wait for the price action draw near either resistance or support before action.
20211215 Hang Seng Index and Month High Low
Moses Power Charting
Official AmiBrokerAcademy.com Charting
Disclaimer
The above result is for illustration purpose. It is meant to be used for learning buy or sell signals. We do not recommend for any particular stocks. If particular stocks of such are mentioned, they are meant as a demonstration of Amibroker as a powerful charting software. Amibroker is a charting software, it can program to scan the stocks for buy and sell signals. Or backtest for any trading strategy or technique.
We post script generated signals. Not all scan results are shown here depending on selection criterial. The MACD signal should use with price action. Users must understand what MACD and price action are all about before using them. If necessary you should attend a course to learn more on Technical Analysis (TA) and Moving Average Convergence Divergence, MACD.
Once again, the website does not guarantee any results or investment return based on the information and instruction you have read here. It should be used as learning aids only and if you decide to trade real money, all trading decision should be your own.
We learn from many past and present great traders. Kudo to these master.
Welcome to AmiBroker Academy dot com, amibrokeracademy.com.
If There is Only One Chart This is It
This is not a site that provides buy or sell signals directly. We read the stock chart bar by bar. If you understand what we read, you will get the buy or sell idea. Have fun!
Buy or Sell, you decide
Trading is very simple yet very difficult. Price is either up or down. But catch the right move is not easy. I believe many must have missed the falling knife. Now, many will be watching the topping. Can any catch the topping? Will see.
Up Down or Sideways
Trading is all probability. The price action is either up, down or sideways.
Trade what you see. Manage your risk.
Our Believe – Buy Support Sell Resistance.
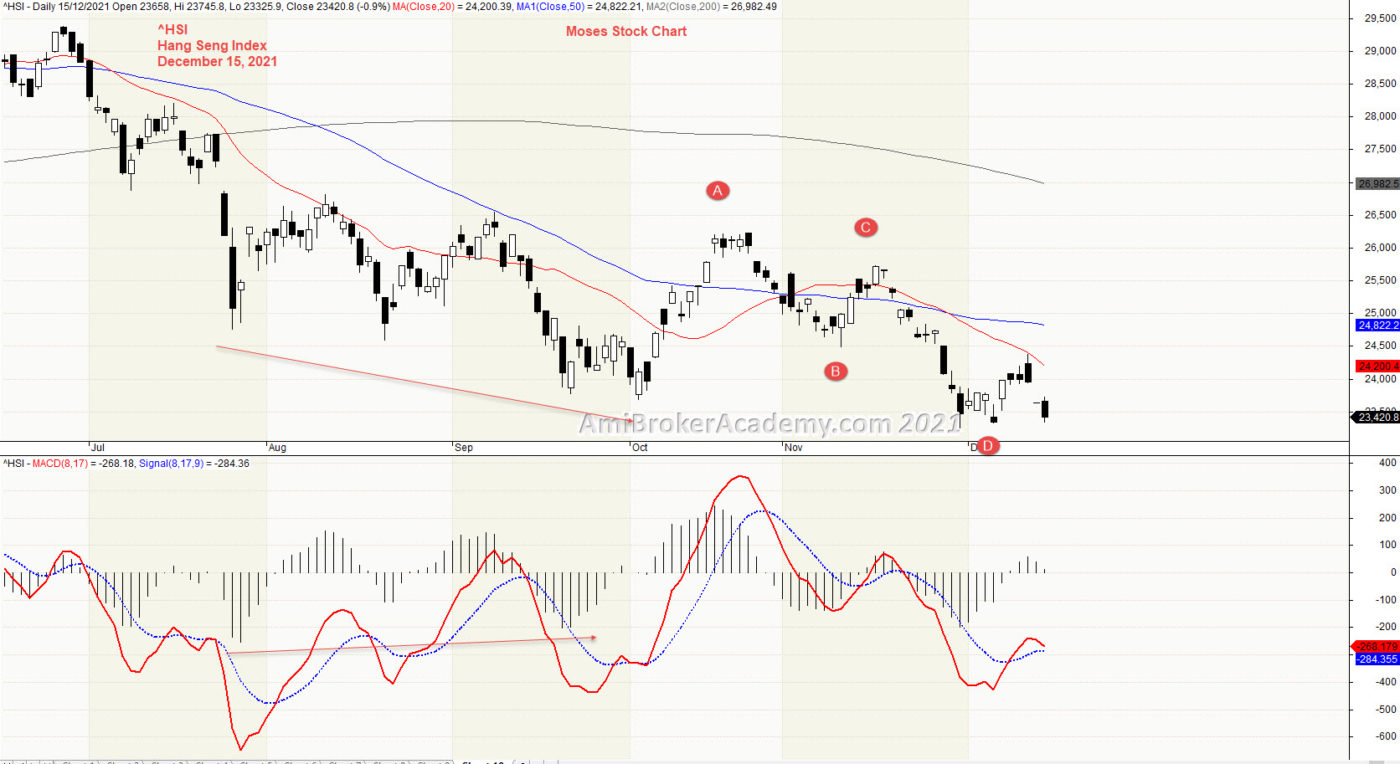
1) Hang Seng Index and MACD
Picture worth a thousand words. Moving Average is a great visual tool for trend. From the higher high or lower high will give you a great visual trending.
We see price action continue to form lower low, but the MACD-H forms higher low. MACD divergence. In other words, MACD or MACD-H get strengthen, when price action get weaker. Price Action maybe reversing.
See chart.
If you are a buy and hold strategist, Will you sell now or buy now? Remember only buy near support, and sell near resistance. Wait for the price action draw near either resistance or support before action.
20211215 Hang Seng Index and MACD
Moses Power Charting
Official AmiBrokerAcademy.com Charting
Disclaimer
The above result is for illustration purpose. It is meant to be used for learning buy or sell signals. We do not recommend for any particular stocks. If particular stocks of such are mentioned, they are meant as a demonstration of Amibroker as a powerful charting software. Amibroker is a charting software, it can program to scan the stocks for buy and sell signals. Or backtest for any trading strategy or technique.
We post script generated signals. Not all scan results are shown here depending on selection criterial. The MACD signal should use with price action. Users must understand what MACD and price action are all about before using them. If necessary you should attend a course to learn more on Technical Analysis (TA) and Moving Average Convergence Divergence, MACD.
Once again, the website does not guarantee any results or investment return based on the information and instruction you have read here. It should be used as learning aids only and if you decide to trade real money, all trading decision should be your own.
We learn from many past and present great traders. Kudo to these master.
Welcome to AmiBroker Academy dot com, amibrokeracademy.com.
If There is Only One Chart This is It
This is not a site that provides buy or sell signals directly. We read the stock chart bar by bar. If you understand what we read, you will get the buy or sell idea. Have fun!
Buy or Sell, you decide
Trading is very simple yet very difficult. Price is either up or down. But catch the right move is not easy. I believe many must have missed the falling knife. Now, many will be watching the topping. Can any catch the topping? Will see.
Up Down or Sideways
Trading is all probability. The price action is either up, down or sideways.
Trade what you see. Manage your risk.
Our Believe – Buy Support Sell Resistance.
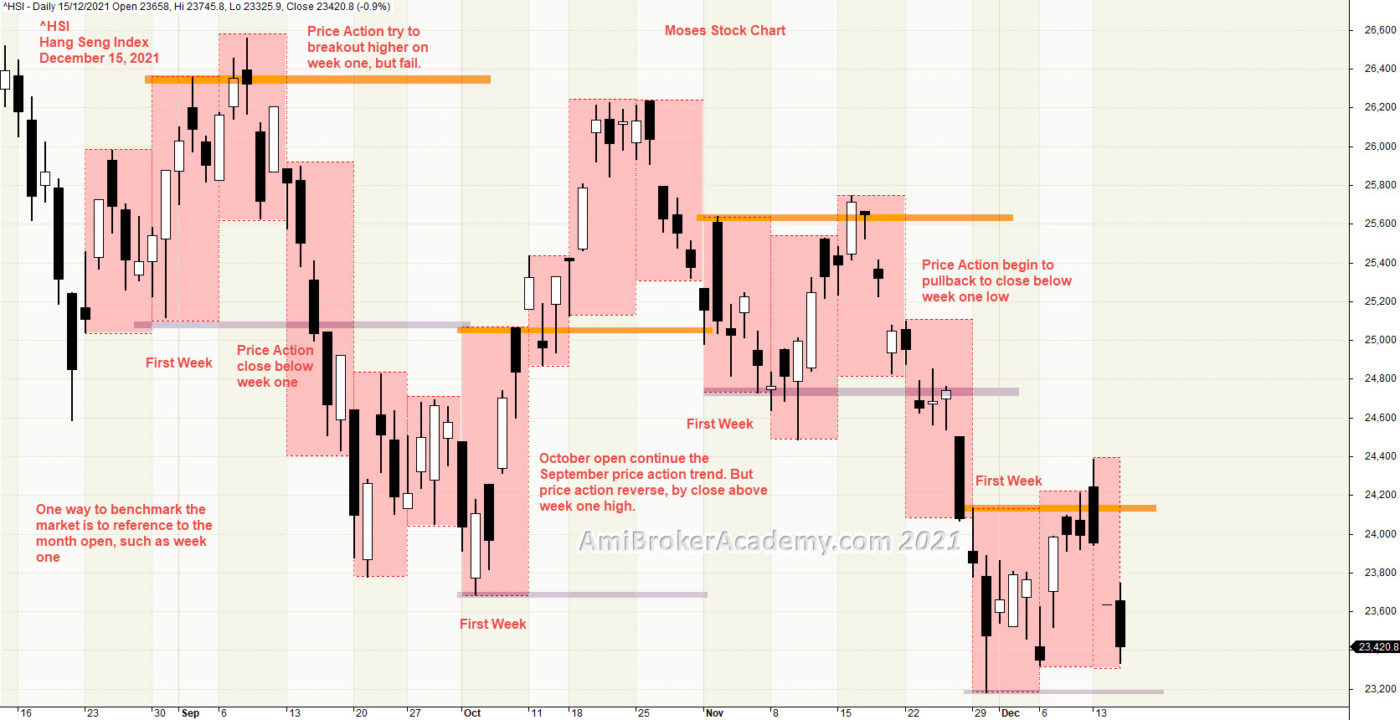
1) Hang Seng Index and week high low
Picture worth a thousand words. Price Action fail to go higher, and close below first week low. Price Action after test the low and begin to rebounce. Price Action begin to close above October first week high. But the high fail to continue to go higher. Price Action forms lower high. If you a ABCD pattern fan, you will find the bear abce pattern.
Price Action close below November first week low and test lower low.
See chart.
If you are a buy and hold strategist, Will you sell now or buy now? Remember only buy near support, and sell near resistance. Wait for the price action draw near either resistance or support before action.
From the chart, price action is now new support zone.
20211215 Hang Seng Index and week high low
Moses Power Charting
Official AmiBrokerAcademy.com Charting
Disclaimer
The above result is for illustration purpose. It is meant to be used for learning buy or sell signals. We do not recommend for any particular stocks. If particular stocks of such are mentioned, they are meant as a demonstration of Amibroker as a powerful charting software. Amibroker is a charting software, it can program to scan the stocks for buy and sell signals. Or backtest for any trading strategy or technique.
We post script generated signals. Not all scan results are shown here depending on selection criterial. The MACD signal should use with price action. Users must understand what MACD and price action are all about before using them. If necessary you should attend a course to learn more on Technical Analysis (TA) and Moving Average Convergence Divergence, MACD.
Once again, the website does not guarantee any results or investment return based on the information and instruction you have read here. It should be used as learning aids only and if you decide to trade real money, all trading decision should be your own.
We learn from many past and present great traders. Kudo to these master.
Welcome to AmiBroker Academy dot com, amibrokeracademy.com.
If There is Only One Chart This is It
This is not a site that provides buy or sell signals directly. We read the stock chart bar by bar. If you understand what we read, you will get the buy or sell idea. Have fun!
Buy or Sell, you decide
Trading is very simple yet very difficult. Price is either up or down. But catch the right move is not easy. I believe many must have missed the falling knife. Now, many will be watching the topping. Can any catch the topping? Will see.
Up Down or Sideways
Trading is all probability. The price action is either up, down or sideways.
Trade what you see. Manage your risk.
Our Believe – Buy Support Sell Resistance.
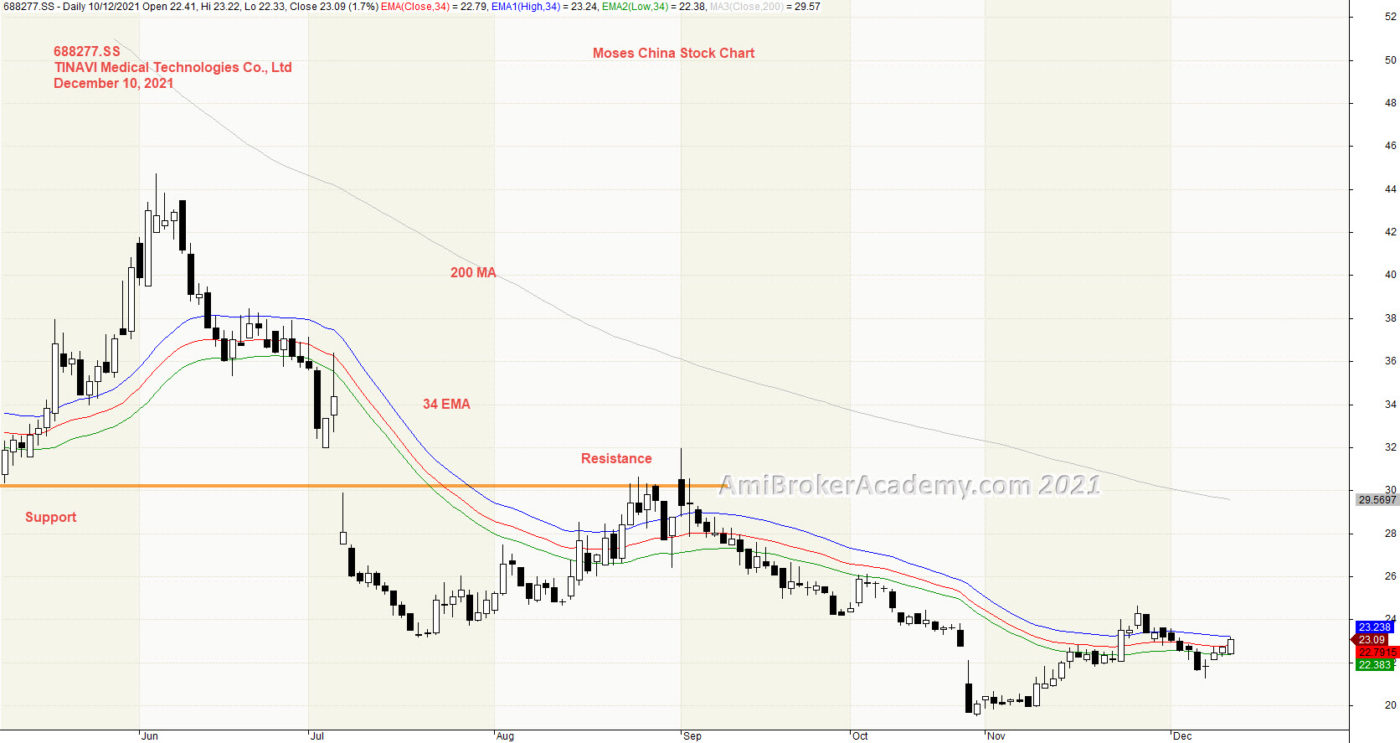
1) TINAVI Medical Technologies Co week high low
Picture worth a thousand words. Moving Average is a great tool for visual trending. You can see the price action is below 200 MA, and 200 MA is slopping down. Bear trending. From a different view, you see price action zipping up and down of the shorter time moving average, such as 34 EMA. Price Action close above in June, and close below. Price Action attempt to close above 34 EMA but fail. Price Action continue to stay below 34 EMA. Besides that 34 EMA is also slopping down.
See chart.
If you are a buy and hold strategist, Will you sell now or buy now? Remember only buy near support, and sell near resistance. Wait for the price action draw near either resistance or support.
From the chart, price action is below resistance zone.
20211210 TINAVI Medical Technologies Co River
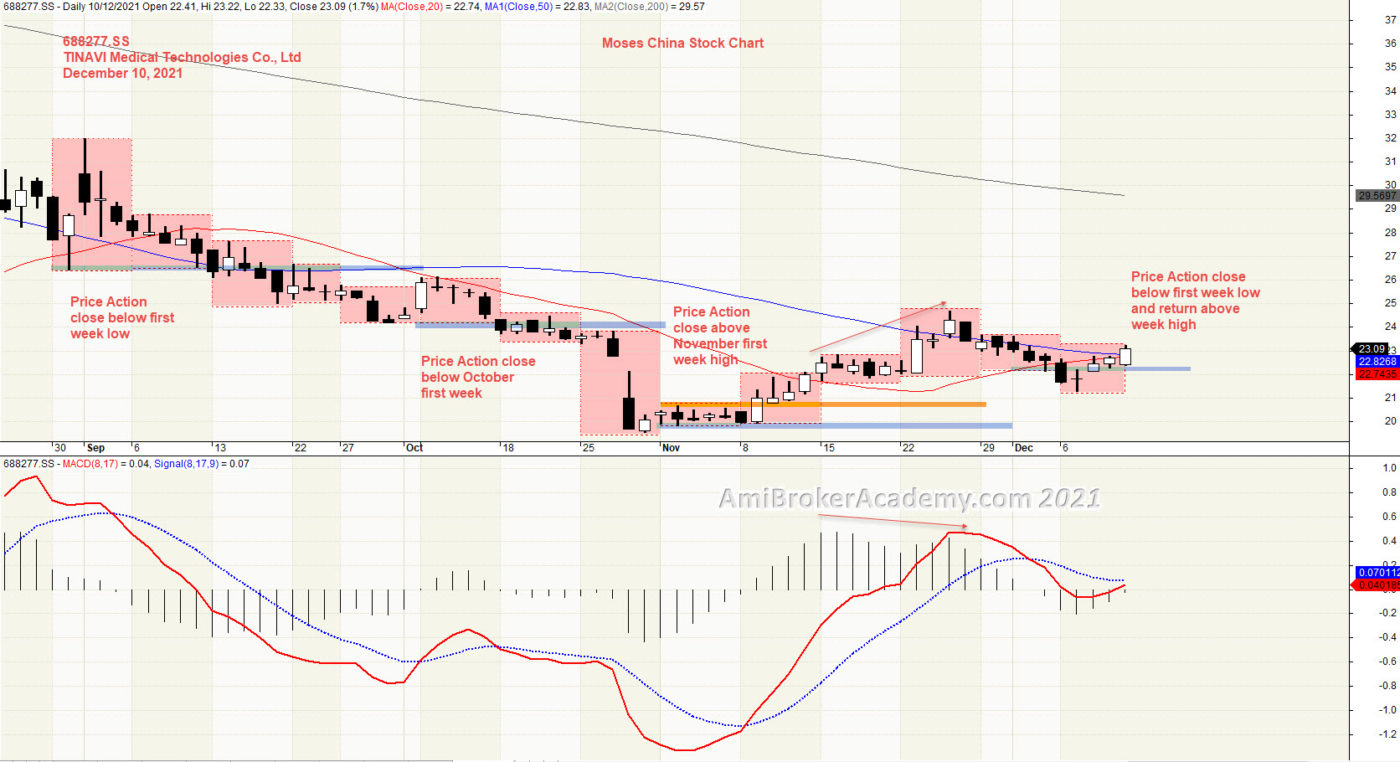
Week High Low
Picture worth a thousand words. From chart, we see price action continue to close below first week low for two months. And price action begin to close above first week high in November.
See chart. Price Action is begin to reversal.
20211210 TINAVI Medical Technologies Co week high low
Moses Power Charting
Official AmiBrokerAcademy.com Charting
Disclaimer
The above result is for illustration purpose. It is meant to be used for learning buy or sell signals. We do not recommend for any particular stocks. If particular stocks of such are mentioned, they are meant as a demonstration of Amibroker as a powerful charting software. Amibroker is a charting software, it can program to scan the stocks for buy and sell signals. Or backtest for any trading strategy or technique.
We post script generated signals. Not all scan results are shown here depending on selection criterial. The MACD signal should use with price action. Users must understand what MACD and price action are all about before using them. If necessary you should attend a course to learn more on Technical Analysis (TA) and Moving Average Convergence Divergence, MACD.
Once again, the website does not guarantee any results or investment return based on the information and instruction you have read here. It should be used as learning aids only and if you decide to trade real money, all trading decision should be your own.
We learn from many past and present great traders. Kudo to these master.
Welcome to AmiBroker Academy dot com, amibrokeracademy.com.
If There is Only One Chart This is It
This is not a site that provides buy or sell signals directly. We read the stock chart bar by bar. If you understand what we read, you will get the buy or sell idea. Have fun!
Buy or Sell, you decide
Trading is very simple yet very difficult. Price is either up or down. But catch the right move is not easy. I believe many must have missed the falling knife. Now, many will be watching the topping. Can any catch the topping? Will see.
Up Down or Sideways
Trading is all probability. The price action is either up, down or sideways.
Trade what you see. Manage your risk.
Our Believe – Buy Support Sell Resistance.
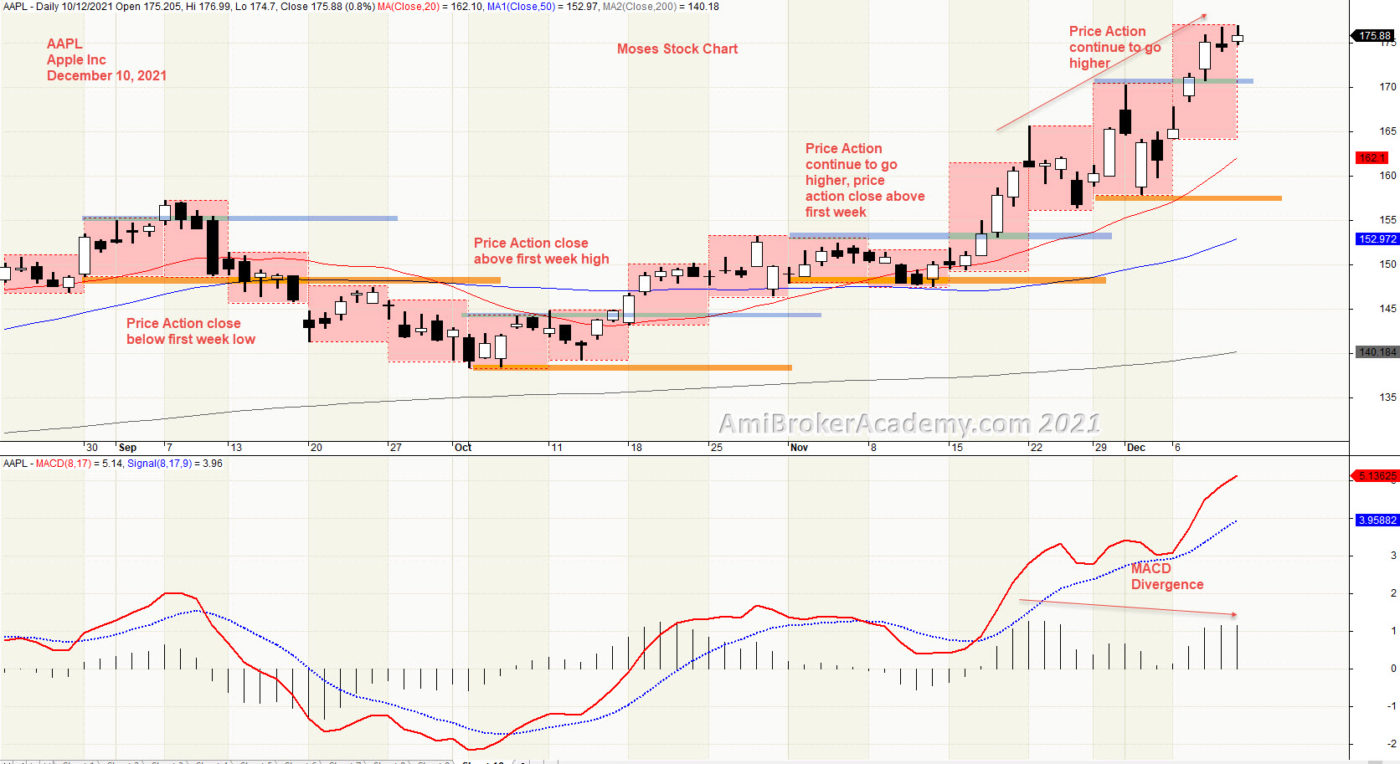
1) Apple Inc Week High Low
Picture worth a thousand words. We did a benchmark for past two years stock chart. Price Action stop going higher for nearly one year. Finally the price action breakout and go higher. Now zoom in to do a weekly high low analysis. Price Action went lower in September, price action close below first week low. But, price action begin to close above October first week high, and continue, price action close above November first week high. Same for December. But we can only conclude at December month close.
See chart.
If you are a buy and hold strategist, Will you sell now or buy now? Remember only buy near support, and sell near resistance. Wait for the price action draw near either resistance or support before action.
From the chart, price action is now below the resistance zone.
20211210 Apple Ince Week High Low
Moses Power Charting
Official AmiBrokerAcademy.com Charting
Disclaimer
The above result is for illustration purpose. It is meant to be used for learning buy or sell signals. We do not recommend for any particular stocks. If particular stocks of such are mentioned, they are meant as a demonstration of Amibroker as a powerful charting software. Amibroker is a charting software, it can program to scan the stocks for buy and sell signals. Or backtest for any trading strategy or technique.
We post script generated signals. Not all scan results are shown here depending on selection criterial. The MACD signal should use with price action. Users must understand what MACD and price action are all about before using them. If necessary you should attend a course to learn more on Technical Analysis (TA) and Moving Average Convergence Divergence, MACD.
Once again, the website does not guarantee any results or investment return based on the information and instruction you have read here. It should be used as learning aids only and if you decide to trade real money, all trading decision should be your own.
We learn from many past and present great traders. Kudo to these master.
Welcome to AmiBroker Academy dot com, amibrokeracademy.com.
If There is Only One Chart This is It
This is not a site that provides buy or sell signals directly. We read the stock chart bar by bar. If you understand what we read, you will get the buy or sell idea. Have fun!
Buy or Sell, you decide
Trading is very simple yet very difficult. Price is either up or down. But catch the right move is not easy. I believe many must have missed the falling knife. Now, many will be watching the topping. Can any catch the topping? Will see.
Up Down or Sideways
Trading is all probability. The price action is either up, down or sideways.
Trade what you see. Manage your risk.
Our Believe – Buy Support Sell Resistance.
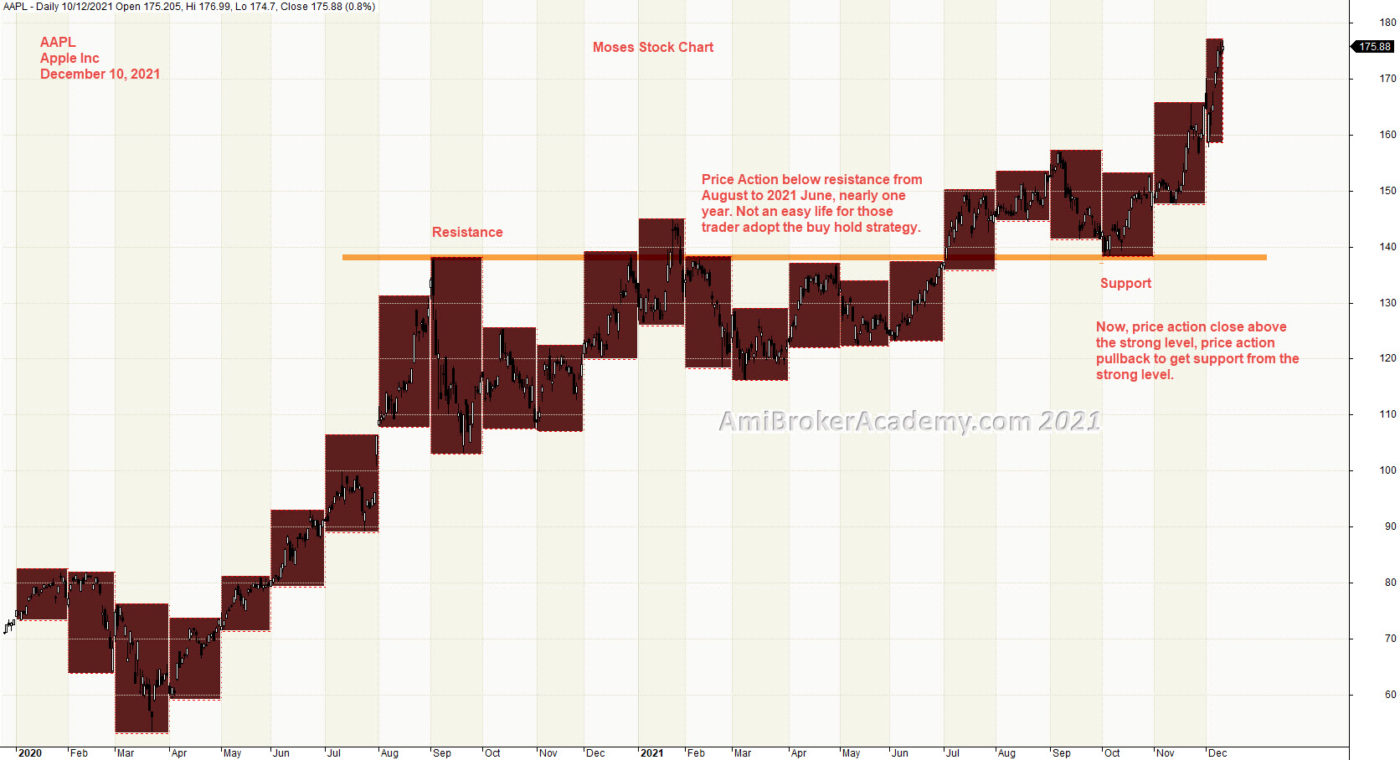
1) Apple Inc Month High Low from 2020
Picture worth a thousand words. Benchmark the two years stock chart. Price Action continues to go higher from the start of year 2020. But, the price action seem to stop after August, 2020. Price Action get resisted. Price Action continue to remain below the level from August till June 2021, almost twelve months.
Price Action finally close above the strong level, price action pullback to test the floor, resistance turns support.
See chart.
If you are a buy and hold strategist, Will you sell now or buy now? Remember only buy near support, and sell near resistance. Wait for the price action draw near either resistance or support.
From the chart, price action is now above the support zone.
20211210 Apple Inc Month High Low from 2020
Moses Power Charting
Official AmiBrokerAcademy.com Charting
Disclaimer
The above result is for illustration purpose. It is meant to be used for learning buy or sell signals. We do not recommend for any particular stocks. If particular stocks of such are mentioned, they are meant as a demonstration of Amibroker as a powerful charting software. Amibroker is a charting software, it can program to scan the stocks for buy and sell signals. Or backtest for any trading strategy or technique.
We post script generated signals. Not all scan results are shown here depending on selection criterial. The MACD signal should use with price action. Users must understand what MACD and price action are all about before using them. If necessary you should attend a course to learn more on Technical Analysis (TA) and Moving Average Convergence Divergence, MACD.
Once again, the website does not guarantee any results or investment return based on the information and instruction you have read here. It should be used as learning aids only and if you decide to trade real money, all trading decision should be your own.
We learn from many past and present great traders. Kudo to these master.
Welcome to AmiBroker Academy dot com, amibrokeracademy.com.
If There is Only One Chart This is It
This is not a site that provides buy or sell signals directly. We read the stock chart bar by bar. If you understand what we read, you will get the buy or sell idea. Have fun!
Buy or Sell, you decide
Trading is very simple yet very difficult. Price is either up or down. But catch the right move is not easy. I believe many must have missed the falling knife. Now, many will be watching the topping. Can any catch the topping? Will see.
Up Down or Sideways
Trading is all probability. The price action is either up, down or sideways.
Trade what you see. Manage your risk.
Our Believe – Buy Support Sell Resistance.
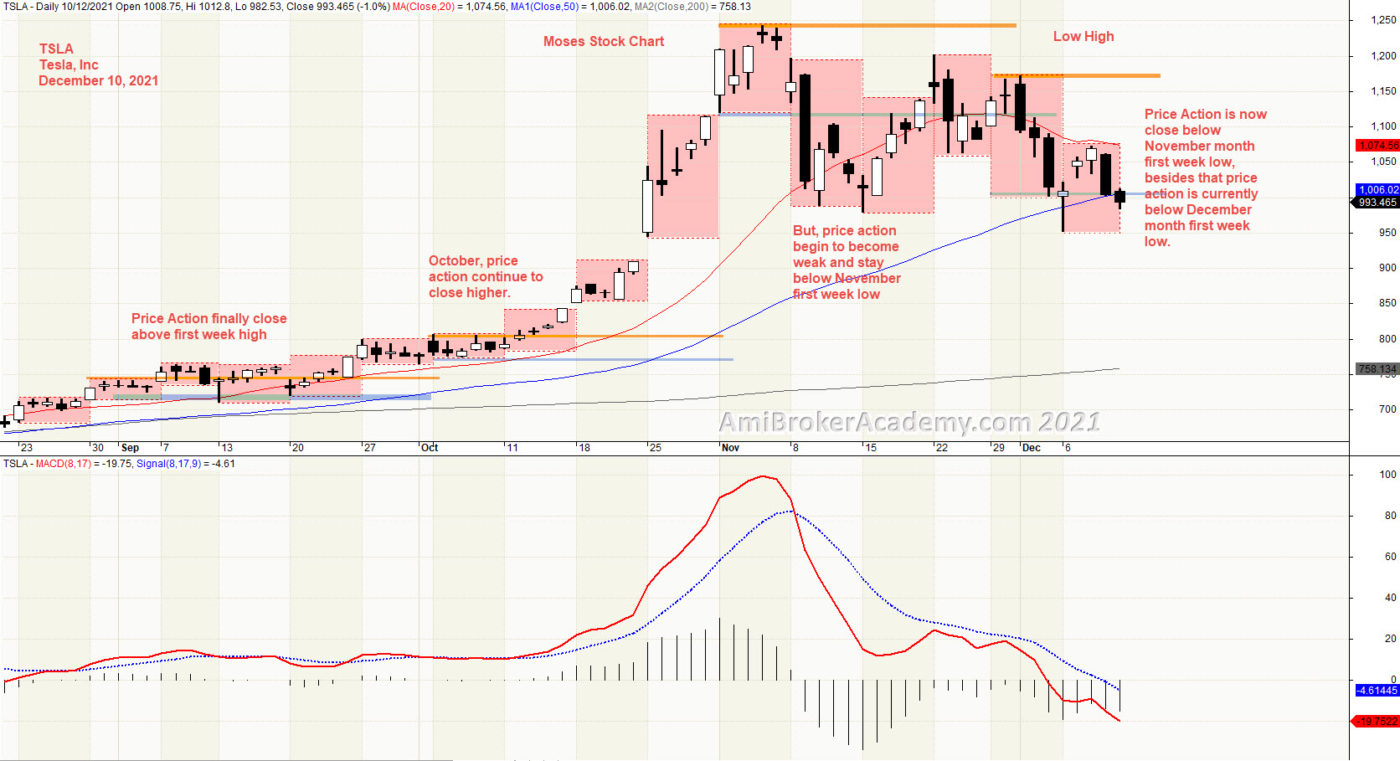
1) Tesla Inc and Week High Low
Picture worth a thousand words. We did a benchmark for past two years stock chart. Price Action continues to go higher from the start of year 2020. Now we zoom in to understand where will the price action go to. From the weekly high low, we see price action continue to go higher in September, October, and November. But, price action become weaker in November. See chart, we see price action form lower high. price action also sink below the November first week low.
See chart.
If you are a buy and hold strategist, Will you sell now or buy now? Remember only buy near support, and sell near resistance. Wait for the price action draw near either resistance or support before action.
From the chart, price action is now below the resistance zone.
20211210 Tesla Inc and Week High Low
Moses Power Charting
Official AmiBrokerAcademy.com Charting
Disclaimer
The above result is for illustration purpose. It is meant to be used for learning buy or sell signals. We do not recommend for any particular stocks. If particular stocks of such are mentioned, they are meant as a demonstration of Amibroker as a powerful charting software. Amibroker is a charting software, it can program to scan the stocks for buy and sell signals. Or backtest for any trading strategy or technique.
We post script generated signals. Not all scan results are shown here depending on selection criterial. The MACD signal should use with price action. Users must understand what MACD and price action are all about before using them. If necessary you should attend a course to learn more on Technical Analysis (TA) and Moving Average Convergence Divergence, MACD.
Once again, the website does not guarantee any results or investment return based on the information and instruction you have read here. It should be used as learning aids only and if you decide to trade real money, all trading decision should be your own.
We learn from many past and present great traders. Kudo to these master.
Welcome to AmiBroker Academy dot com, amibrokeracademy.com.
If There is Only One Chart This is It
This is not a site that provides buy or sell signals directly. We read the stock chart bar by bar. If you understand what we read, you will get the buy or sell idea. Have fun!
Buy or Sell, you decide
Trading is very simple yet very difficult. Price is either up or down. But catch the right move is not easy. I believe many must have missed the falling knife. Now, many will be watching the topping. Can any catch the topping? Will see.
Up Down or Sideways
Trading is all probability. The price action is either up, down or sideways.
Trade what you see. Manage your risk.
Our Believe – Buy Support Sell Resistance.
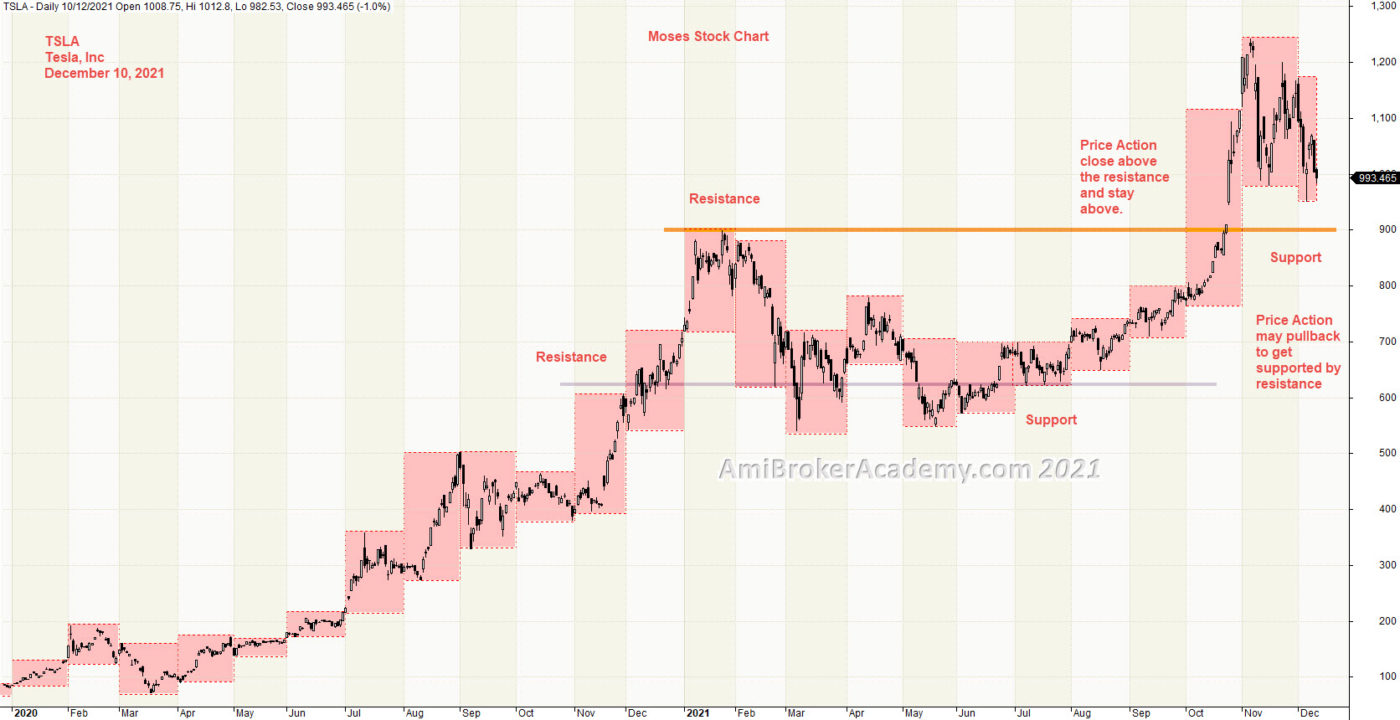
1) Tesla Inc and Month High Low from 2020
Picture worth a thousand words. Benchmark the two years stock chart. Price Action continues to go higher from the start of year 2020. But, the price action seem to retrace back to the last high, high of 2021 January month high. So, the price action is covered back most of the gap up.
See chart. To understand the price action better, you can see our weekly high low analysis.
If you are a buy and hold strategist, Will you sell now or buy now? Remember only buy near support, and sell near resistance. Wait for the price action draw near either resistance or support.
From the chart, price action is now above the support zone.
20211210 Tesla Inc and Month High Low from 2020
Moses Power Charting
Official AmiBrokerAcademy.com Charting
Disclaimer
The above result is for illustration purpose. It is meant to be used for learning buy or sell signals. We do not recommend for any particular stocks. If particular stocks of such are mentioned, they are meant as a demonstration of Amibroker as a powerful charting software. Amibroker is a charting software, it can program to scan the stocks for buy and sell signals. Or backtest for any trading strategy or technique.
We post script generated signals. Not all scan results are shown here depending on selection criterial. The MACD signal should use with price action. Users must understand what MACD and price action are all about before using them. If necessary you should attend a course to learn more on Technical Analysis (TA) and Moving Average Convergence Divergence, MACD.
Once again, the website does not guarantee any results or investment return based on the information and instruction you have read here. It should be used as learning aids only and if you decide to trade real money, all trading decision should be your own.
We learn from many past and present great traders. Kudo to these master.
Welcome to AmiBroker Academy dot com, amibrokeracademy.com.
If There is Only One Chart This is It
This is not a site that provides buy or sell signals directly. We read the stock chart bar by bar. If you understand what we read, you will get the buy or sell idea. Have fun!
Buy or Sell, you decide
Trading is very simple yet very difficult. Price is either up or down. But catch the right move is not easy. I believe many must have missed the falling knife. Now, many will be watching the topping. Can any catch the topping? Will see.
Up Down or Sideways
Trading is all probability. The price action is either up, down or sideways.
Trade what you see. Manage your risk.
Our Believe – Buy Support Sell Resistance.
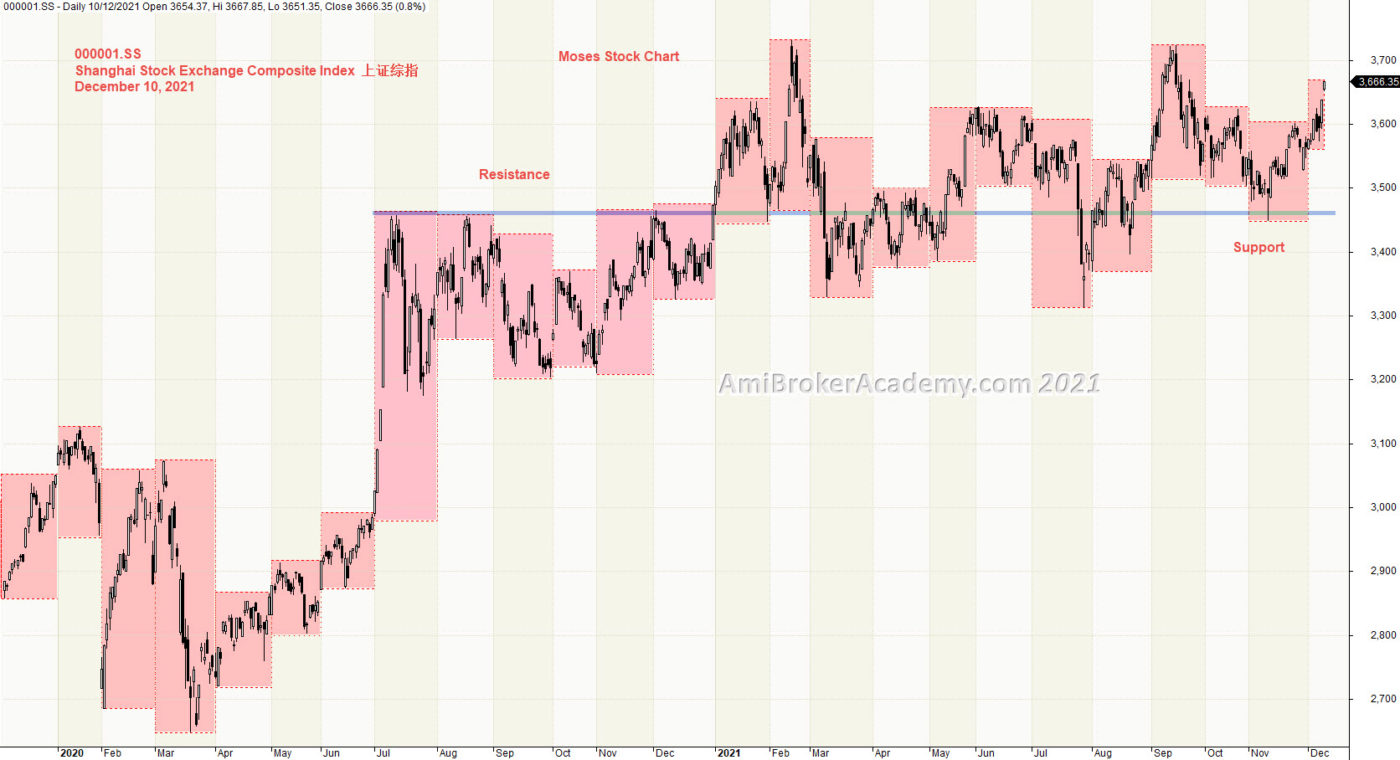
1) 000001.SS Shanghai Stock Exchange Composite Index 上证综指 Month High Low
Picture worth a thousand words. Benchmark the two years stock chart. Price Action resisted by July 2020 month high, and for the next five months, the price action stay below the resistance. In other words, there is six months the price action can not go higher in that level, very strong level. In January 2021, price action close above the resistance, but pullback and support on the same level. So, resistance turns support. If you look right, you will see the price action zigzag along the strong level. Finally, if everything remain unchange, the price action maybe can close above the strong level.
See chart. To understand the price action better, you can see our weekly high low analysis.
If you are a buy and hold strategist, Will you sell now or buy now? Remember only buy near support, and sell near resistance. Wait for the price action draw near either resistance or support.
From the chart, price action is now above the support zone.
20211210 Shanghai Stock Exchange Composite Index 上证综指 Month High Low
Moses Power Charting
Official AmiBrokerAcademy.com Charting
Disclaimer
The above result is for illustration purpose. It is meant to be used for learning buy or sell signals. We do not recommend for any particular stocks. If particular stocks of such are mentioned, they are meant as a demonstration of Amibroker as a powerful charting software. Amibroker is a charting software, it can program to scan the stocks for buy and sell signals. Or backtest for any trading strategy or technique.
We post script generated signals. Not all scan results are shown here depending on selection criterial. The MACD signal should use with price action. Users must understand what MACD and price action are all about before using them. If necessary you should attend a course to learn more on Technical Analysis (TA) and Moving Average Convergence Divergence, MACD.
Once again, the website does not guarantee any results or investment return based on the information and instruction you have read here. It should be used as learning aids only and if you decide to trade real money, all trading decision should be your own.
We learn from many past and present great traders. Kudo to these master.