Welcome to AmiBroker Academy dot com, amibrokeracademy.com.
If There is Only One Chart This is It
Moses Stock Chart.
Our Believe – Buy Support Sell Resistance.
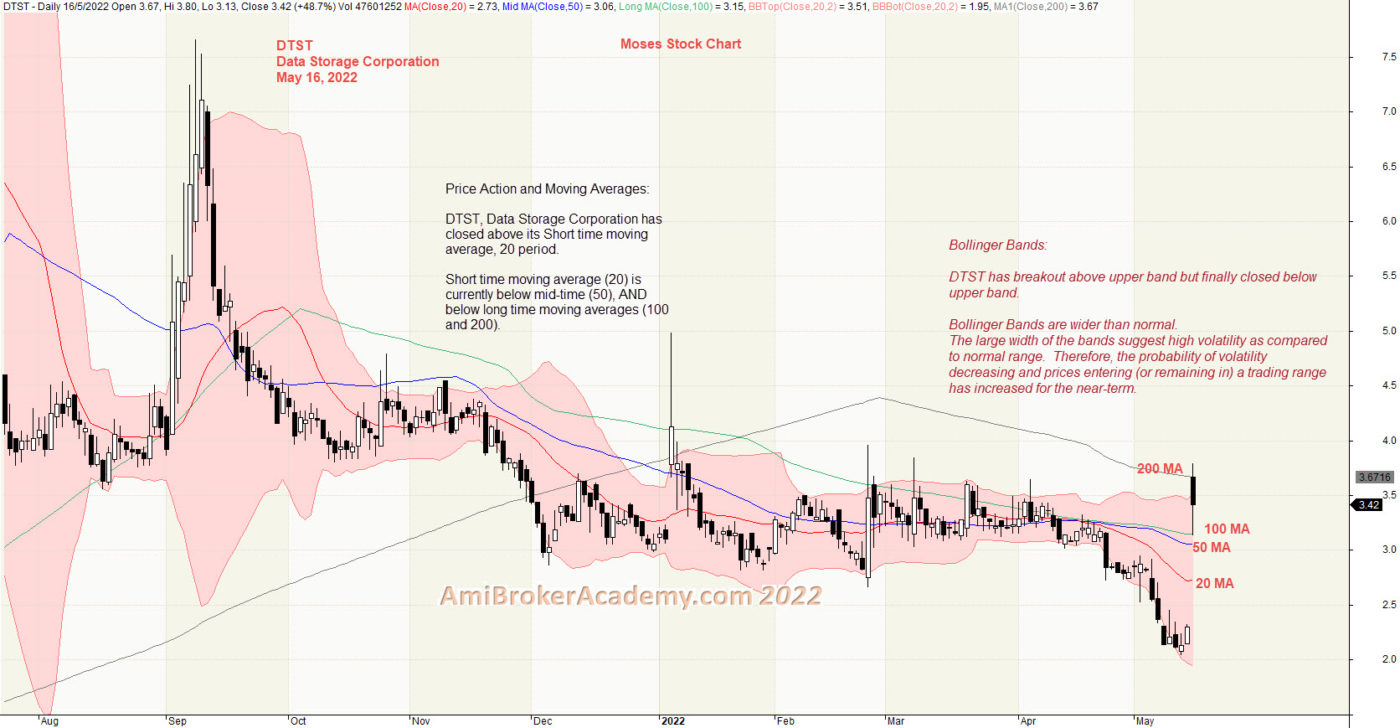
1) Data Storage Corp and Bollinger Bands and Moving Average
Price Action reflect the market emotions, it factor in news, buy or sell emotions.
See chart. Price Action breakout above Bollinger Band upper band, but finally close below the upper band. Study the Bollinger Bands, the band is wider compare to the last few months, it means the price action is now more volatile as compare to last two months. See chart.
If you are a buy and hold strategist, Will you sell now or buy now? Remember only buy near support, and sell near resistance. Wait for the price action draw near either resistance or support before action.
20220516 Data Storage Corp and Bollinger Bands and Moving Average
Moses Power Charting
Official AmiBrokerAcademy.com Charting
Disclaimer
The above result is for illustration purpose. It is meant to be used for learning buy or sell signals. We do not recommend for any particular stocks. If particular stocks of such are mentioned, they are meant as a demonstration of Amibroker as a powerful charting software. Amibroker is a charting software, it can program to scan the stocks for buy and sell signals. Or backtest for any trading strategy or technique.
We post script generated signals. Not all scan results are shown here depending on selection criterial. The MACD signal should use with price action. Users must understand what MACD and price action are all about before using them. If necessary you should attend a course to learn more on Technical Analysis (TA) and Moving Average Convergence Divergence, MACD.
Once again, the website does not guarantee any results or investment return based on the information and instruction you have read here. It should be used as learning aids only and if you decide to trade real money, all trading decision should be your own.
We learn from many past and present great traders. Kudo to these master.
Welcome to AmiBroker Academy dot com, amibrokeracademy.com.
If There is Only One Chart This is It
Moses Month High Low Chart.
Our Believe – Buy Support Sell Resistance.
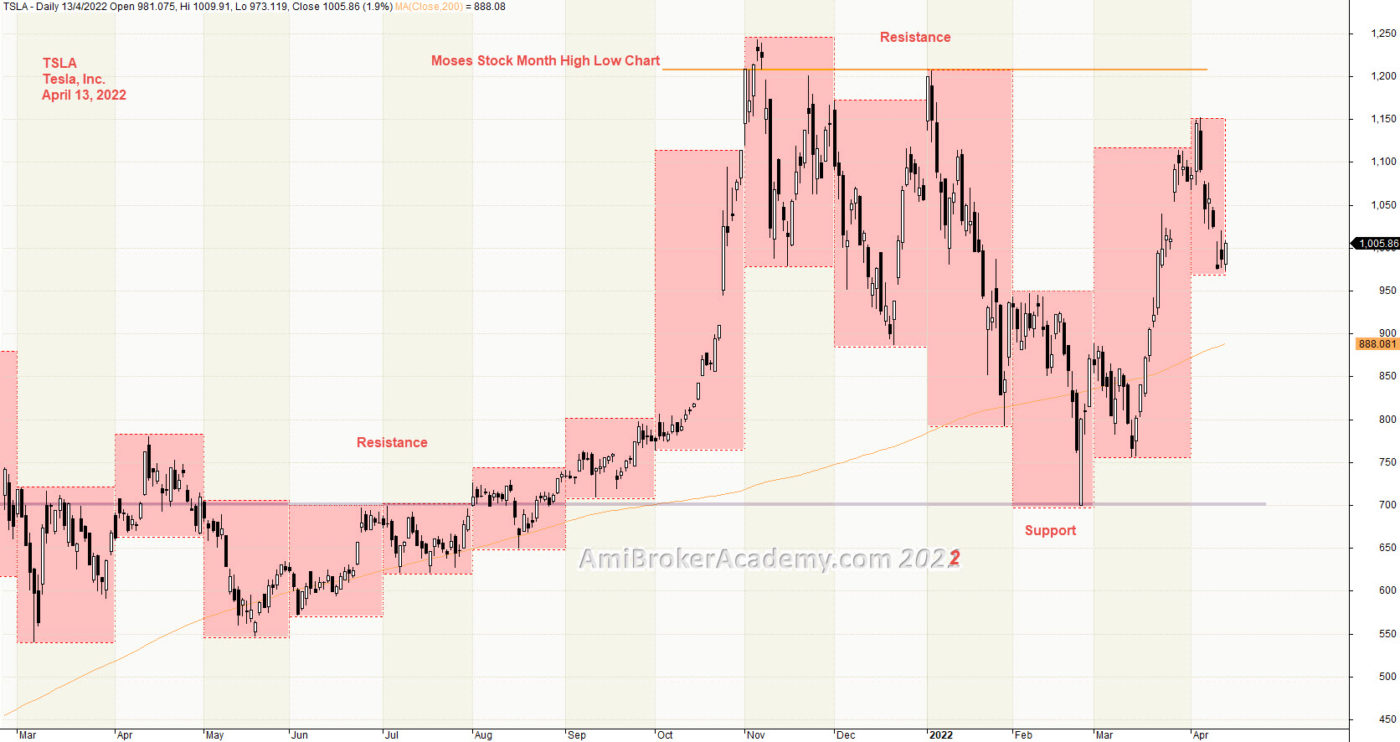
1) Tesla Inc and Month High Low
Price Action reflect the market emotions, it factor in news, buy or sell emotions.
Price Action is either up or down.
See chart. Month High Low,
If you are a buy and hold strategist, Will you sell now or buy now? Remember only buy near support, and sell near resistance. Wait for the price action draw near either resistance or support before action.
20220413 Tesla Inc and Month High Low
Moses Power Charting
Official AmiBrokerAcademy.com Charting
Disclaimer
The above result is for illustration purpose. It is meant to be used for learning buy or sell signals. We do not recommend for any particular stocks. If particular stocks of such are mentioned, they are meant as a demonstration of Amibroker as a powerful charting software. Amibroker is a charting software, it can program to scan the stocks for buy and sell signals. Or backtest for any trading strategy or technique.
We post script generated signals. Not all scan results are shown here depending on selection criterial. The MACD signal should use with price action. Users must understand what MACD and price action are all about before using them. If necessary you should attend a course to learn more on Technical Analysis (TA) and Moving Average Convergence Divergence, MACD.
Once again, the website does not guarantee any results or investment return based on the information and instruction you have read here. It should be used as learning aids only and if you decide to trade real money, all trading decision should be your own.
We learn from many past and present great traders. Kudo to these master.
Welcome to AmiBroker Academy dot com, amibrokeracademy.com.
If There is Only One Chart This is It
Moses MACD Chart.
Our Believe – Buy Support Sell Resistance.
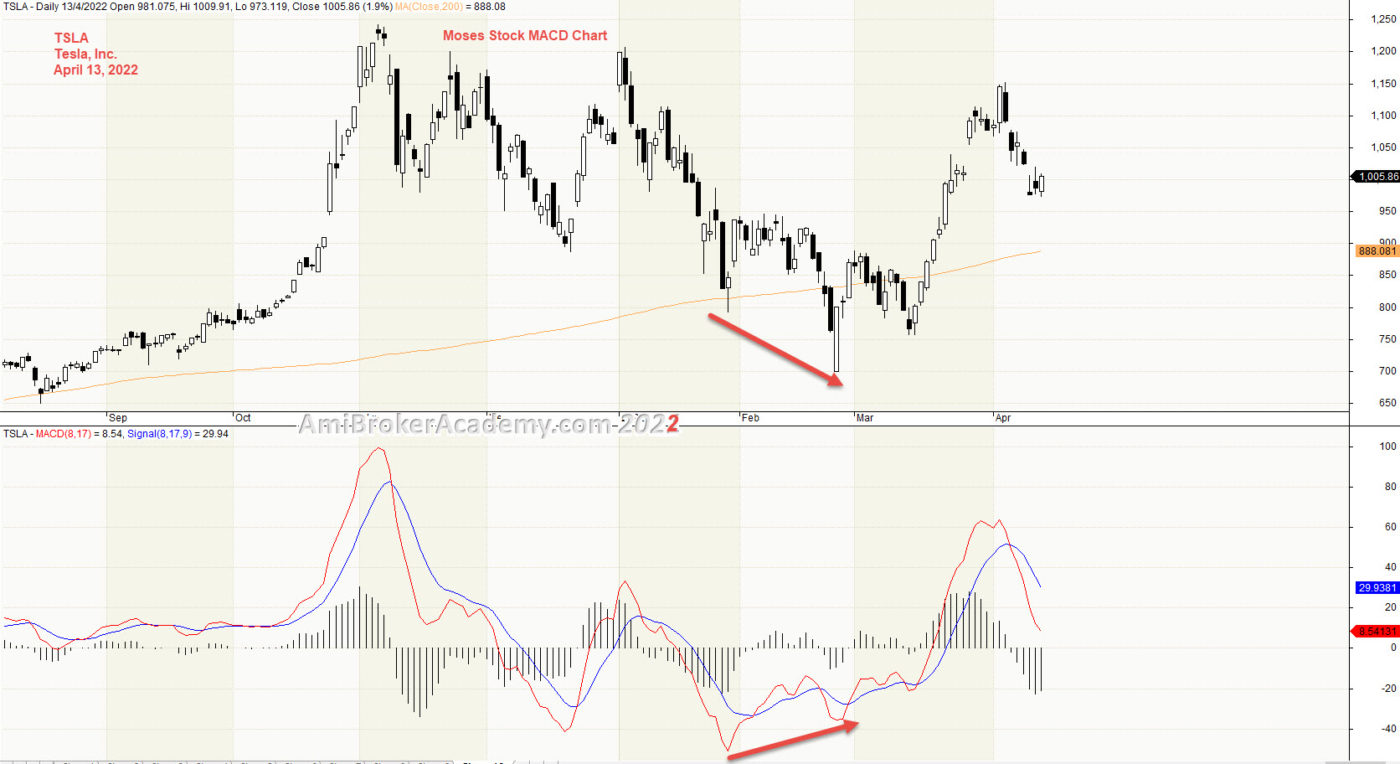
1) Tesla Inc and MACD Divergence
Price Action reflect the market emotions, it factor in news, buy or sell emotions.
Price Action is either up or down.
See chart. MACD Divergence,
If you are a buy and hold strategist, Will you sell now or buy now? Remember only buy near support, and sell near resistance. Wait for the price action draw near either resistance or support before action.
20220413 Tesla Inc and MACD Divergence
Moses Power Charting
Official AmiBrokerAcademy.com Charting
Disclaimer
The above result is for illustration purpose. It is meant to be used for learning buy or sell signals. We do not recommend for any particular stocks. If particular stocks of such are mentioned, they are meant as a demonstration of Amibroker as a powerful charting software. Amibroker is a charting software, it can program to scan the stocks for buy and sell signals. Or backtest for any trading strategy or technique.
We post script generated signals. Not all scan results are shown here depending on selection criterial. The MACD signal should use with price action. Users must understand what MACD and price action are all about before using them. If necessary you should attend a course to learn more on Technical Analysis (TA) and Moving Average Convergence Divergence, MACD.
Once again, the website does not guarantee any results or investment return based on the information and instruction you have read here. It should be used as learning aids only and if you decide to trade real money, all trading decision should be your own.
We learn from many past and present great traders. Kudo to these master.
Welcome to AmiBroker Academy dot com, amibrokeracademy.com.
If There is Only One Chart This is It
Moses Month High Low Chart.
Our Believe – Buy Support Sell Resistance.
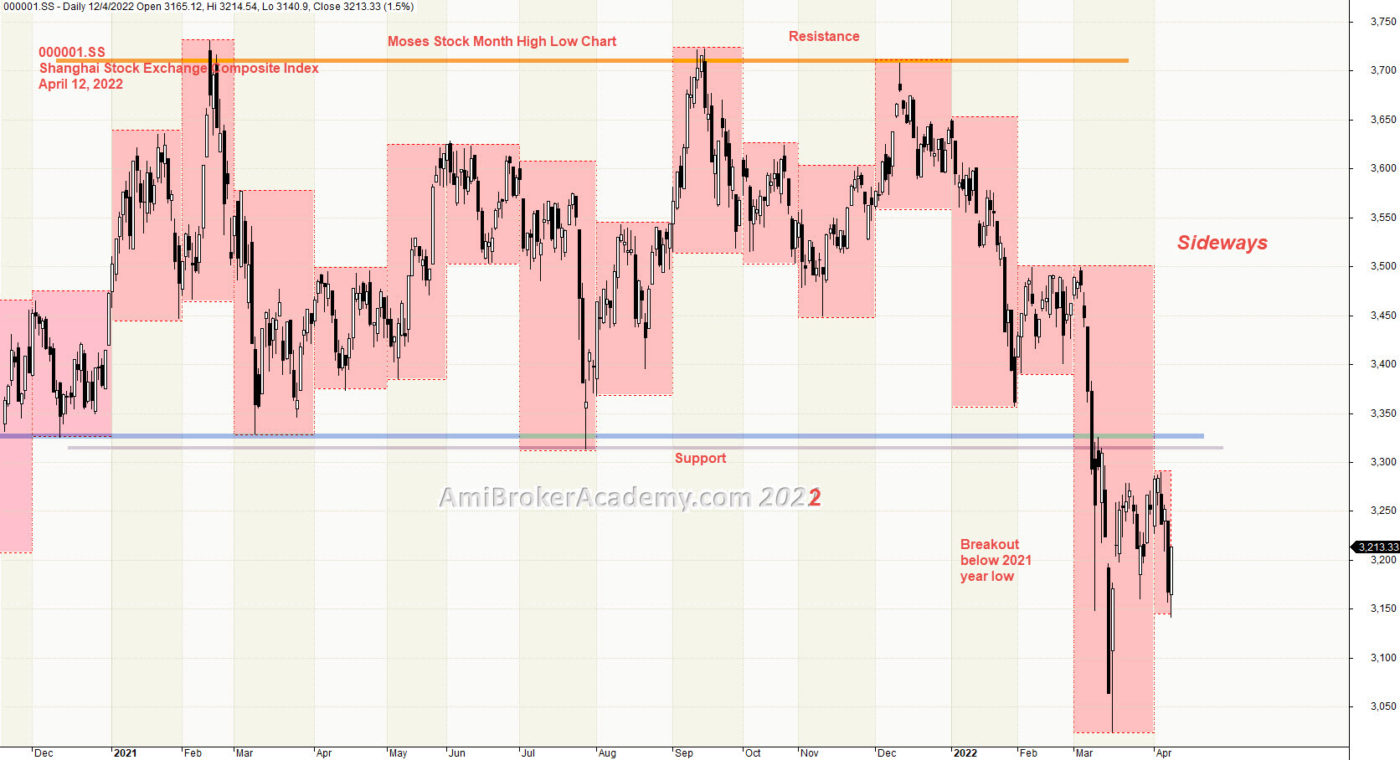
1) Shanghai Stock Exchange Composite Index month high low
Price Action reflect the market emotions, it factor in news, buy or sell emotions.
Price Action is either up or down.
See chart. Price Action close below support, bearish.
If you are a buy and hold strategist, Will you sell now or buy now? Remember only buy near support, and sell near resistance. Wait for the price action draw near either resistance or support before action.
20220412 Shanghai Stock Exchange Composite Index month high low
Moses Power Charting
Official AmiBrokerAcademy.com Charting
Disclaimer
The above result is for illustration purpose. It is meant to be used for learning buy or sell signals. We do not recommend for any particular stocks. If particular stocks of such are mentioned, they are meant as a demonstration of Amibroker as a powerful charting software. Amibroker is a charting software, it can program to scan the stocks for buy and sell signals. Or backtest for any trading strategy or technique.
We post script generated signals. Not all scan results are shown here depending on selection criterial. The MACD signal should use with price action. Users must understand what MACD and price action are all about before using them. If necessary you should attend a course to learn more on Technical Analysis (TA) and Moving Average Convergence Divergence, MACD.
Once again, the website does not guarantee any results or investment return based on the information and instruction you have read here. It should be used as learning aids only and if you decide to trade real money, all trading decision should be your own.
We learn from many past and present great traders. Kudo to these master.
Welcome to AmiBroker Academy dot com, amibrokeracademy.com.
If There is Only One Chart This is It
This is not a site that provides buy or sell signals directly. We read the stock chart bar by bar. If you understand what we read, you will get the buy or sell idea. Have fun!
Buy or Sell, you decide
Trading is very simple yet very difficult. Price is either up or down. But catch the right move is not easy. I believe many must have missed the falling knife. Now, many will be watching the topping. Can any catch the topping? Will see.
Up Down or Sideways
Trading is all probability. The price action is either 1) up, 2) down or 3) sideways.
Trade what you see. Manage your risk.
Our Believe – Buy Support Sell Resistance.
Bull or Bear
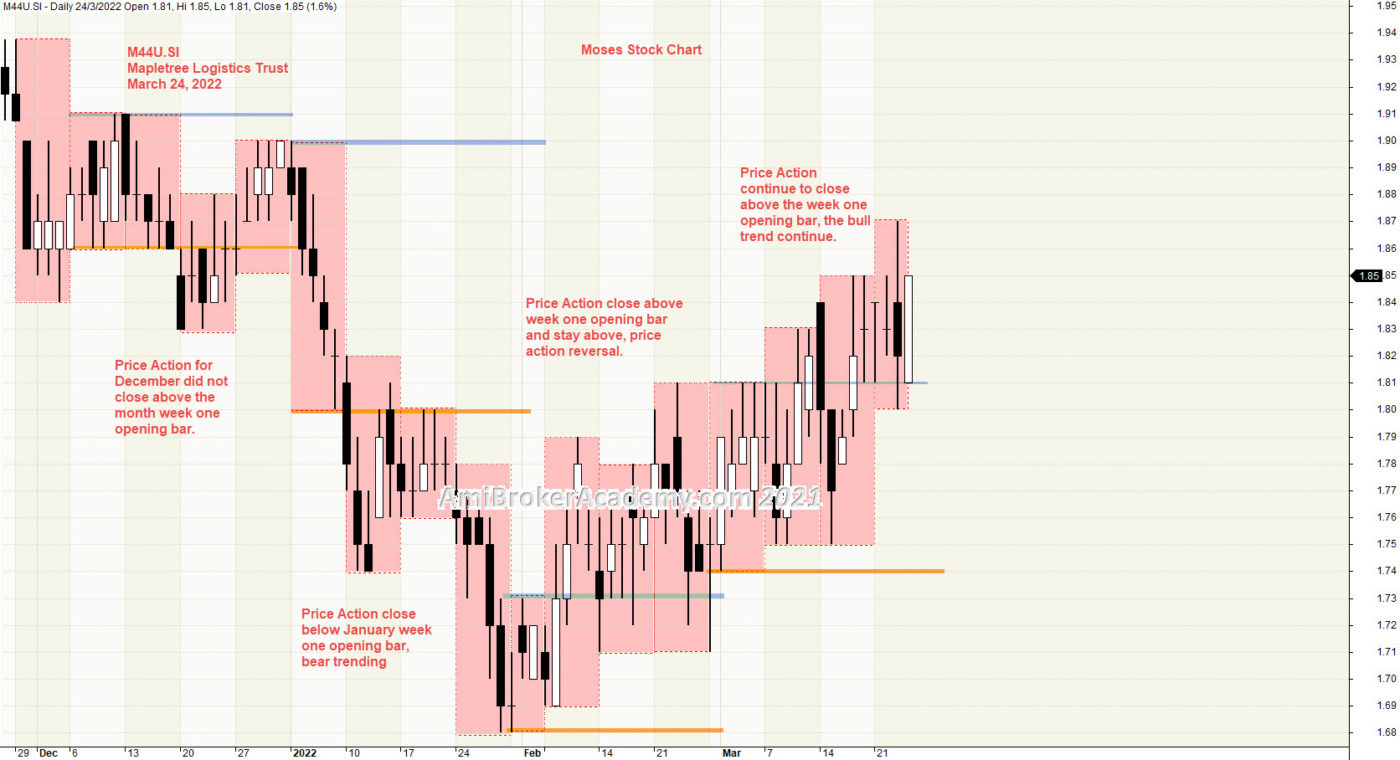
Bull or Bear trend is reference to the past trend. So, we use week one of each month as reference to determine the month trend. See the chart below.
1) Mapletree Logistics Trust Week High Low and Opening Bar
Price Action reflect the market emotions, it factor in news, buy or sell emotions.
Price Action is either up or down.
See chart. Price Action close below the week one low and reverse.
If you are a buy and hold strategist, Will you sell now or buy now? Remember only buy near support, and sell near resistance. Wait for the price action draw near either resistance or support before action.
20220324 Mapletree Logistics Trust week high low and opening bar
Moses Power Charting
Official AmiBrokerAcademy.com Charting
Disclaimer
The above result is for illustration purpose. It is meant to be used for learning buy or sell signals. We do not recommend for any particular stocks. If particular stocks of such are mentioned, they are meant as a demonstration of Amibroker as a powerful charting software. Amibroker is a charting software, it can program to scan the stocks for buy and sell signals. Or backtest for any trading strategy or technique.
We post script generated signals. Not all scan results are shown here depending on selection criterial. The MACD signal should use with price action. Users must understand what MACD and price action are all about before using them. If necessary you should attend a course to learn more on Technical Analysis (TA) and Moving Average Convergence Divergence, MACD.
Once again, the website does not guarantee any results or investment return based on the information and instruction you have read here. It should be used as learning aids only and if you decide to trade real money, all trading decision should be your own.
We learn from many past and present great traders. Kudo to these master.
Welcome to AmiBroker Academy dot com, amibrokeracademy.com.
If There is Only One Chart This is It
This is not a site that provides buy or sell signals directly. We read the stock chart bar by bar. If you understand what we read, you will get the buy or sell idea. Have fun!
Buy or Sell, you decide
Trading is very simple yet very difficult. Price is either up or down. But catch the right move is not easy. I believe many must have missed the falling knife. Now, many will be watching the topping. Can any catch the topping? Will see.
Up Down or Sideways
Trading is all probability. The price action is either 1) up, 2) down or 3) sideways.
Trade what you see. Manage your risk.
Our Believe – Buy Support Sell Resistance.
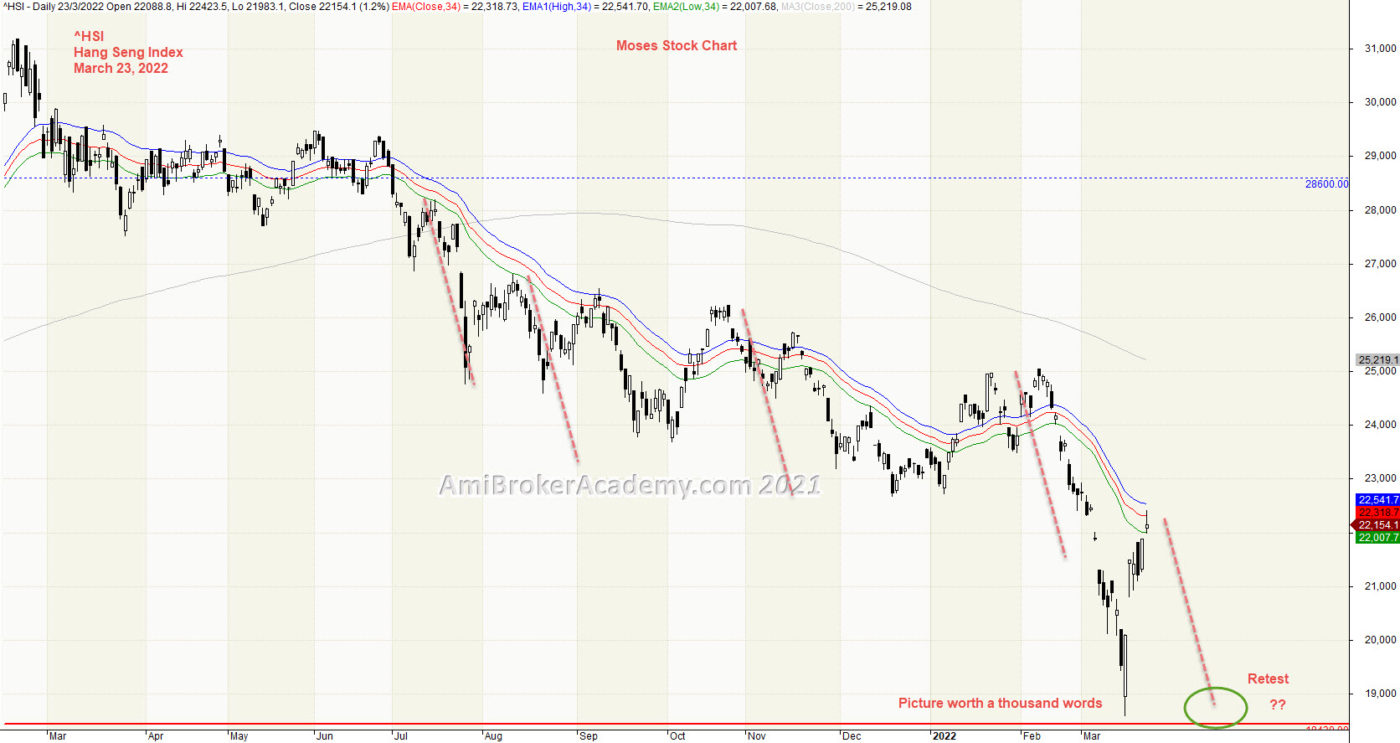
1) Hang Seng Index and River
Moving Average is a great visual tool for charting. When price action below river and river is slopping down, price action is bearish. On the other hands, when price action is above river and river is slopping up, price action is bullish. Chart can not lie, so, what you see is what the market emotion.
Price Action is either above or below the River, Moving Average.
See chart. AB = CD, will the price action retest the low again? Will see.
If you are a buy and hold strategist, Will you sell now or buy now? Remember only buy near support, and sell near resistance. Wait for the price action draw near either resistance or support before action.
20220323 Hang Seng Index and River
Moses Power Charting
Official AmiBrokerAcademy.com Charting
Disclaimer
The above result is for illustration purpose. It is meant to be used for learning buy or sell signals. We do not recommend for any particular stocks. If particular stocks of such are mentioned, they are meant as a demonstration of Amibroker as a powerful charting software. Amibroker is a charting software, it can program to scan the stocks for buy and sell signals. Or backtest for any trading strategy or technique.
We post script generated signals. Not all scan results are shown here depending on selection criterial. The MACD signal should use with price action. Users must understand what MACD and price action are all about before using them. If necessary you should attend a course to learn more on Technical Analysis (TA) and Moving Average Convergence Divergence, MACD.
Once again, the website does not guarantee any results or investment return based on the information and instruction you have read here. It should be used as learning aids only and if you decide to trade real money, all trading decision should be your own.
We learn from many past and present great traders. Kudo to these master.
Welcome to AmiBroker Academy dot com, amibrokeracademy.com.
If There is Only One Chart This is It
This is not a site that provides buy or sell signals directly. We read the stock chart bar by bar. If you understand what we read, you will get the buy or sell idea. Have fun!
Buy or Sell, you decide
Trading is very simple yet very difficult. Price is either up or down. But catch the right move is not easy. I believe many must have missed the falling knife. Now, many will be watching the topping. Can any catch the topping? Will see.
Up Down or Sideways
Trading is all probability. The price action is either 1) up, 2) down or 3) sideways.
Trade what you see. Manage your risk.
Our Believe – Buy Support Sell Resistance.
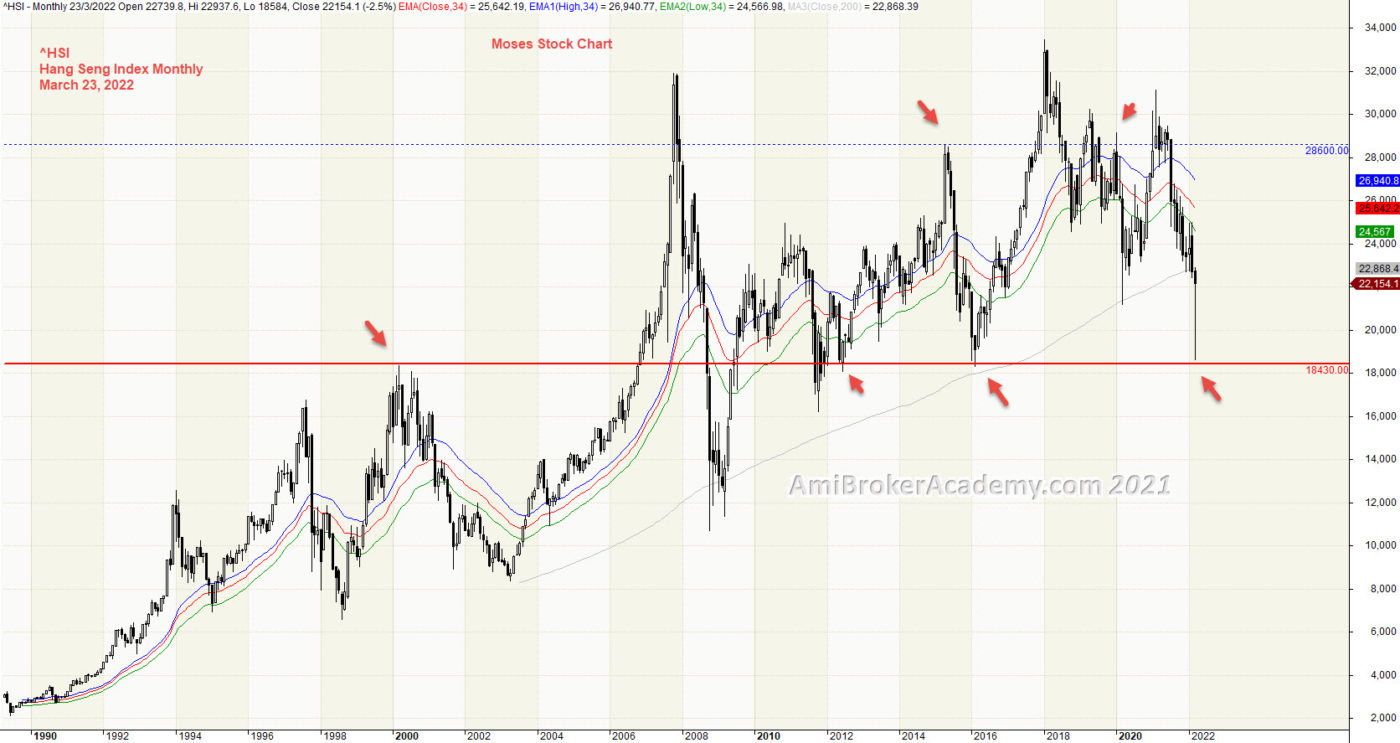
1) Hang Seng Index Monthly Chart
Moving Average is a great visual tool for charting. When price action below river and river is slopping down, price action is bearish. On the other hands, when price action is above river and river is slopping up, price action is bullish. Chart can not lie, so, what you see is what the market emotion.
Price Action is either above or below the River, Moving Average.
See chart. Price Action is bounded by two line, one resistance and one support.
If you are a buy and hold strategist, Will you sell now or buy now? Remember only buy near support, and sell near resistance. Wait for the price action draw near either resistance or support before action.
If you trade within the two lines, you are safe. Sell resistance, and Buy support.
20220323 Hang Seng Index Monthly Chart
Moses Power Charting
Official AmiBrokerAcademy.com Charting
Disclaimer
The above result is for illustration purpose. It is meant to be used for learning buy or sell signals. We do not recommend for any particular stocks. If particular stocks of such are mentioned, they are meant as a demonstration of Amibroker as a powerful charting software. Amibroker is a charting software, it can program to scan the stocks for buy and sell signals. Or backtest for any trading strategy or technique.
We post script generated signals. Not all scan results are shown here depending on selection criterial. The MACD signal should use with price action. Users must understand what MACD and price action are all about before using them. If necessary you should attend a course to learn more on Technical Analysis (TA) and Moving Average Convergence Divergence, MACD.
Once again, the website does not guarantee any results or investment return based on the information and instruction you have read here. It should be used as learning aids only and if you decide to trade real money, all trading decision should be your own.
We learn from many past and present great traders. Kudo to these master.
Welcome to AmiBroker Academy dot com, amibrokeracademy.com.
If There is Only One Chart This is It
This is not a site that provides buy or sell signals directly. We read the stock chart bar by bar. If you understand what we read, you will get the buy or sell idea. Have fun!
Buy or Sell, you decide
Trading is very simple yet very difficult. Price is either up or down. But catch the right move is not easy. I believe many must have missed the falling knife. Now, many will be watching the topping. Can any catch the topping? Will see.
Up Down or Sideways
Trading is all probability. The price action is either 1) up, 2) down or 3) sideways.
Trade what you see. Manage your risk.
Our Believe – Buy Support Sell Resistance.
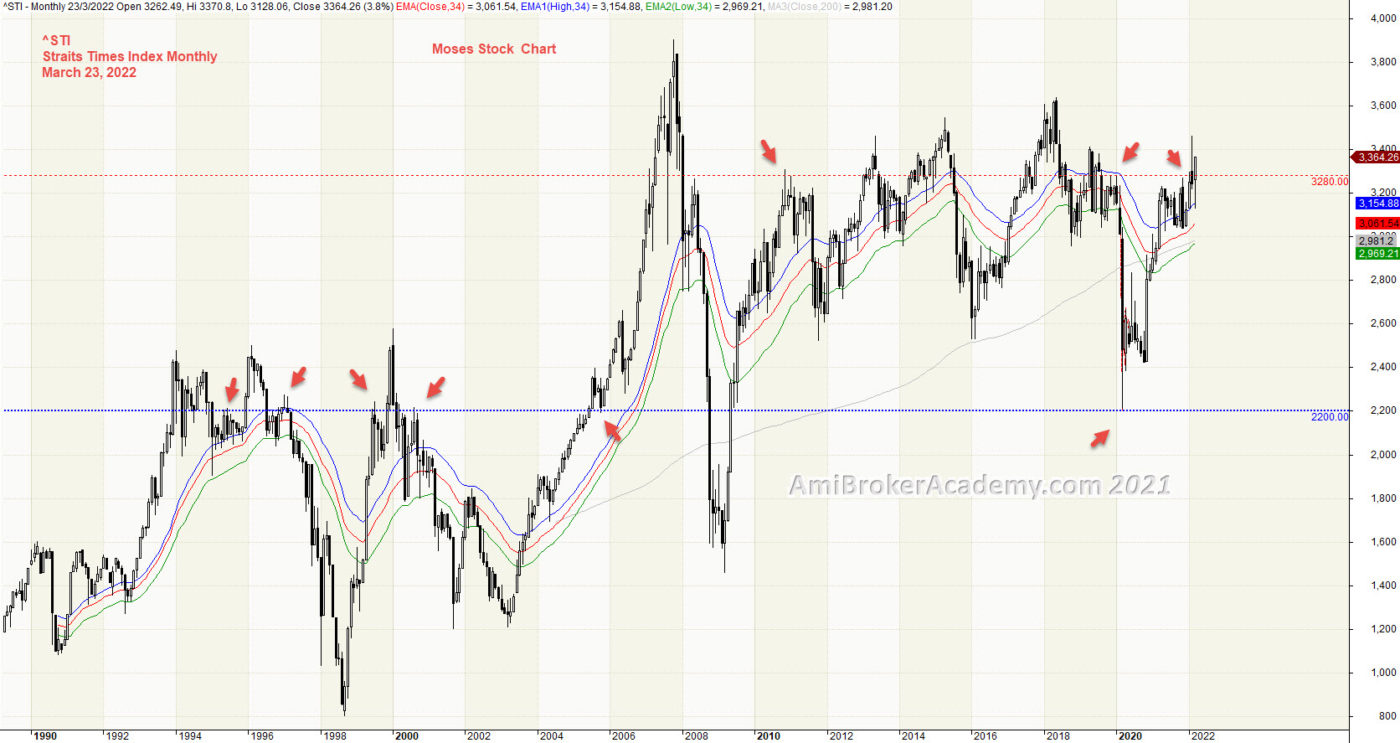
1) Straits Times Index Monthly
Moving Average is a great visual tool for charting. When price action below river and river is slopping down, price action is bearish. On the other hands, when price action is above river and river is slopping up, price action is bullish. Chart can not lie, so, what you see is what the market emotion.
Price Action is either above or below the River, Moving Average.
See chart. Price Action is bounded by two line, one resistance and one support.
If you are a buy and hold strategist, Will you sell now or buy now? Remember only buy near support, and sell near resistance. Wait for the price action draw near either resistance or support before action.
20220323 Straits Times Index Monthly
If you trade within the two lines, you are safe. Sell resistance, and Buy support.
Moses Power Charting
Official AmiBrokerAcademy.com Charting
Disclaimer
The above result is for illustration purpose. It is meant to be used for learning buy or sell signals. We do not recommend for any particular stocks. If particular stocks of such are mentioned, they are meant as a demonstration of Amibroker as a powerful charting software. Amibroker is a charting software, it can program to scan the stocks for buy and sell signals. Or backtest for any trading strategy or technique.
We post script generated signals. Not all scan results are shown here depending on selection criterial. The MACD signal should use with price action. Users must understand what MACD and price action are all about before using them. If necessary you should attend a course to learn more on Technical Analysis (TA) and Moving Average Convergence Divergence, MACD.
Once again, the website does not guarantee any results or investment return based on the information and instruction you have read here. It should be used as learning aids only and if you decide to trade real money, all trading decision should be your own.
We learn from many past and present great traders. Kudo to these master.
Welcome to AmiBroker Academy dot com, amibrokeracademy.com.
If There is Only One Chart This is It
This is not a site that provides buy or sell signals directly. We read the stock chart bar by bar. If you understand what we read, you will get the buy or sell idea. Have fun!
Buy or Sell, you decide
Trading is very simple yet very difficult. Price is either up or down. But catch the right move is not easy. I believe many must have missed the falling knife. Now, many will be watching the topping. Can any catch the topping? Will see.
Up Down or Sideways
Trading is all probability. The price action is either 1) up, 2) down or 3) sideways.
Trade what you see. Manage your risk.
Our Believe – Buy Support Sell Resistance.
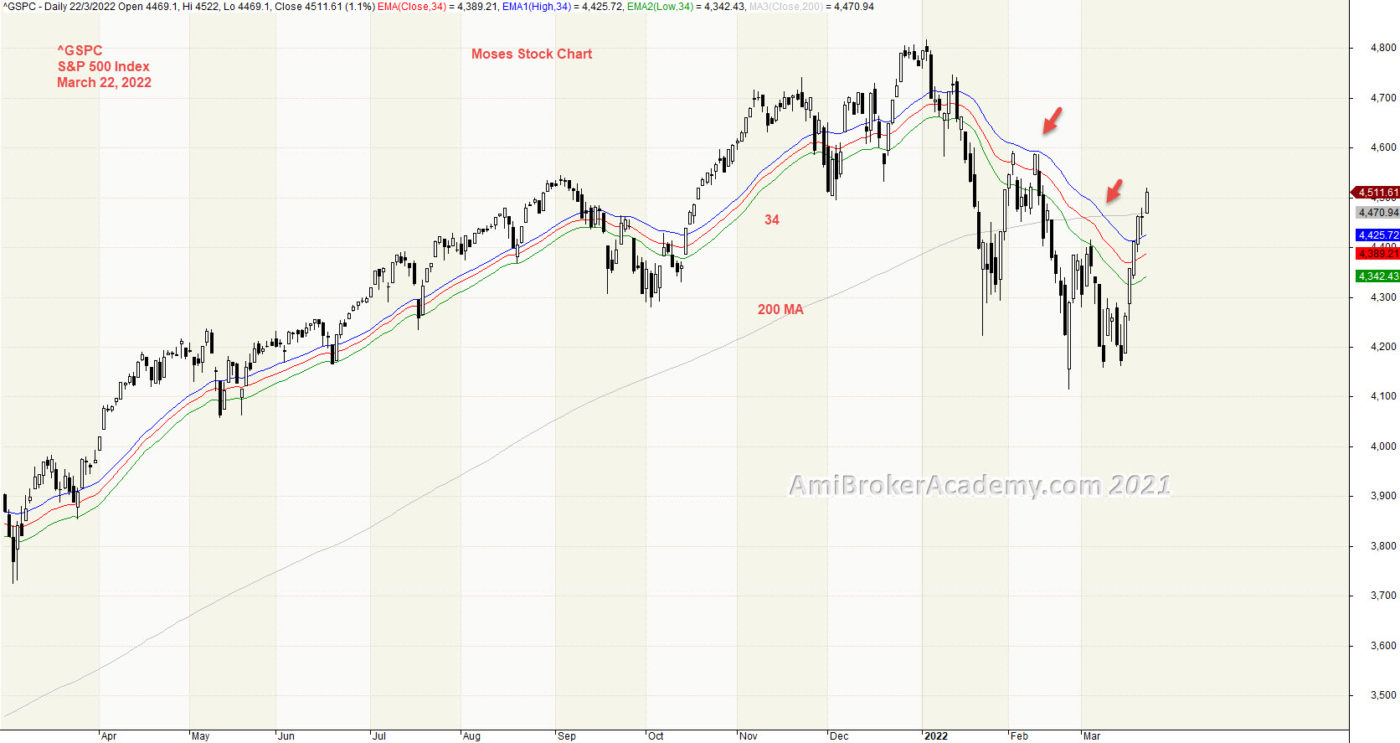
1) S&P 500 Index and River
Moving Average is a great visual tool for charting. When price action below river and river is slopping down, price action is bearish. On the other hands, when price action is above river and river is slopping up, price action is bullish. Chart can not lie, so, what you see is what the market emotion.
In our posting, we was wondering can the price action bullish again. The answer is obvious if the price action like currently the price action continue to breakout river and close above it.
See chart. River is slopping down, the price action close below river at first, and resisted by river two times.
If you are a buy and hold strategist, Will you sell now or buy now? Remember only buy near support, and sell near resistance. Wait for the price action draw near either resistance or support before action.
20220322 S&P 500 Index and River
Moses Power Charting
Official AmiBrokerAcademy.com Charting
Disclaimer
The above result is for illustration purpose. It is meant to be used for learning buy or sell signals. We do not recommend for any particular stocks. If particular stocks of such are mentioned, they are meant as a demonstration of Amibroker as a powerful charting software. Amibroker is a charting software, it can program to scan the stocks for buy and sell signals. Or backtest for any trading strategy or technique.
We post script generated signals. Not all scan results are shown here depending on selection criterial. The MACD signal should use with price action. Users must understand what MACD and price action are all about before using them. If necessary you should attend a course to learn more on Technical Analysis (TA) and Moving Average Convergence Divergence, MACD.
Once again, the website does not guarantee any results or investment return based on the information and instruction you have read here. It should be used as learning aids only and if you decide to trade real money, all trading decision should be your own.
We learn from many past and present great traders. Kudo to these master.
Welcome to AmiBroker Academy dot com, amibrokeracademy.com.
If There is Only One Chart This is It
This is not a site that provides buy or sell signals directly. We read the stock chart bar by bar. If you understand what we read, you will get the buy or sell idea. Have fun!
Buy or Sell, you decide
Trading is very simple yet very difficult. Price is either up or down. But catch the right move is not easy. I believe many must have missed the falling knife. Now, many will be watching the topping. Can any catch the topping? Will see.
Up Down or Sideways
Trading is all probability. The price action is either 1) up, 2) down or 3) sideways.
Trade what you see. Manage your risk.
Our Believe – Buy Support Sell Resistance.
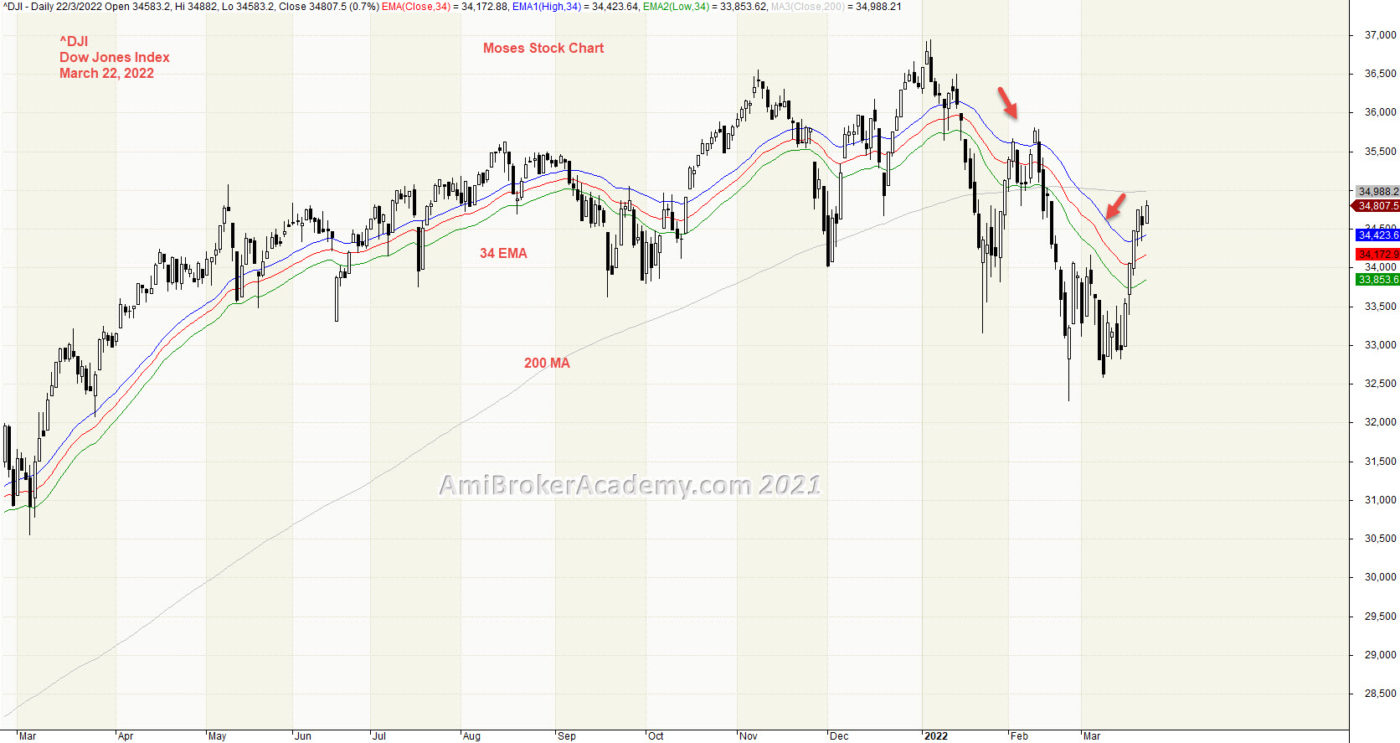
1) Dow Jones Industrial Average Index and River
Moving Average is a great visual tool for charting. When price action below river and river is slopping down, price action is bearish. On the other hands, when price action is above river and river is slopping up, price action is bullish. Chart can not lie, so, what you see is what the market emotion.
In our posting, we was wondering can the price action bullish again. The answer is obvious, currently the price action has test the river and close above it.
See chart. River is slopping down, the price action close below river at first, and resisted by river two times.
If you are a buy and hold strategist, Will you sell now or buy now? Remember only buy near support, and sell near resistance. Wait for the price action draw near either resistance or support before action.
20220322 Dow Jones Industrial Average Index and River
Moses Power Charting
Official AmiBrokerAcademy.com Charting
Disclaimer
The above result is for illustration purpose. It is meant to be used for learning buy or sell signals. We do not recommend for any particular stocks. If particular stocks of such are mentioned, they are meant as a demonstration of Amibroker as a powerful charting software. Amibroker is a charting software, it can program to scan the stocks for buy and sell signals. Or backtest for any trading strategy or technique.
We post script generated signals. Not all scan results are shown here depending on selection criterial. The MACD signal should use with price action. Users must understand what MACD and price action are all about before using them. If necessary you should attend a course to learn more on Technical Analysis (TA) and Moving Average Convergence Divergence, MACD.
Once again, the website does not guarantee any results or investment return based on the information and instruction you have read here. It should be used as learning aids only and if you decide to trade real money, all trading decision should be your own.
We learn from many past and present great traders. Kudo to these master.
Welcome to AmiBroker Academy dot com, amibrokeracademy.com.
If There is Only One Chart This is It
This is not a site that provides buy or sell signals directly. We read the stock chart bar by bar. If you understand what we read, you will get the buy or sell idea. Have fun!
Buy or Sell, you decide
Trading is very simple yet very difficult. Price is either up or down. But catch the right move is not easy. I believe many must have missed the falling knife. Now, many will be watching the topping. Can any catch the topping? Will see.
Up Down or Sideways
Trading is all probability. The price action is either 1) up, 2) down or 3) sideways.
Trade what you see. Manage your risk.
Our Believe – Buy Support Sell Resistance.
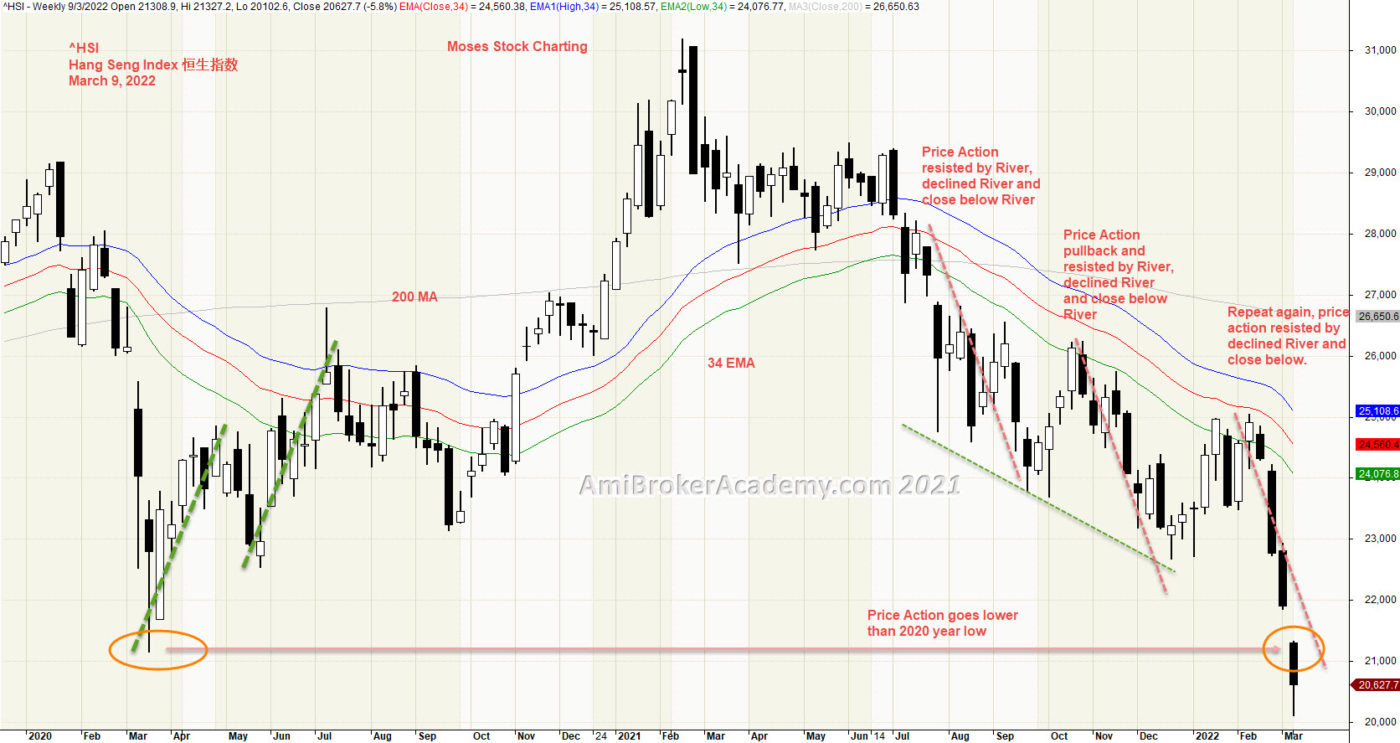
1) Hang Seng Index 恒生指数 and River
Moving Average is a great visual tool for charting. When price action below river and river is slopping down, price action is bearish. On the other hands, when price action is above river and river is slopping up, price action is bullish. Chart can not lie, so, what you see is what the market emotion.
I our previous posting, we was wondering can the price action test the 2020 year low. The answer is obvious, currently the price action has test the low of year 2020 year low.
See chart. River is slopping down, the price action close below river, and resisted by river two times.
If you are a buy and hold strategist, Will you sell now or buy now? Remember only buy near support, and sell near resistance. Wait for the price action draw near either resistance or support before action.
20220309 Hang Seng Index and River
Moses Power Charting
Official AmiBrokerAcademy.com Charting
Disclaimer
The above result is for illustration purpose. It is meant to be used for learning buy or sell signals. We do not recommend for any particular stocks. If particular stocks of such are mentioned, they are meant as a demonstration of Amibroker as a powerful charting software. Amibroker is a charting software, it can program to scan the stocks for buy and sell signals. Or backtest for any trading strategy or technique.
We post script generated signals. Not all scan results are shown here depending on selection criterial. The MACD signal should use with price action. Users must understand what MACD and price action are all about before using them. If necessary you should attend a course to learn more on Technical Analysis (TA) and Moving Average Convergence Divergence, MACD.
Once again, the website does not guarantee any results or investment return based on the information and instruction you have read here. It should be used as learning aids only and if you decide to trade real money, all trading decision should be your own.
We learn from many past and present great traders. Kudo to these master.
Welcome to AmiBroker Academy dot com, amibrokeracademy.com.
If There is Only One Chart This is It
This is not a site that provides buy or sell signals directly. We read the stock chart bar by bar. If you understand what we read, you will get the buy or sell idea. Have fun!
Buy or Sell, you decide
Trading is very simple yet very difficult. Price is either up or down. But catch the right move is not easy. I believe many must have missed the falling knife. Now, many will be watching the topping. Can any catch the topping? Will see.
Up Down or Sideways
Trading is all probability. The price action is either 1) up, 2) down or 3) sideways.
Trade what you see. Manage your risk.
Our Believe – Buy Support Sell Resistance.
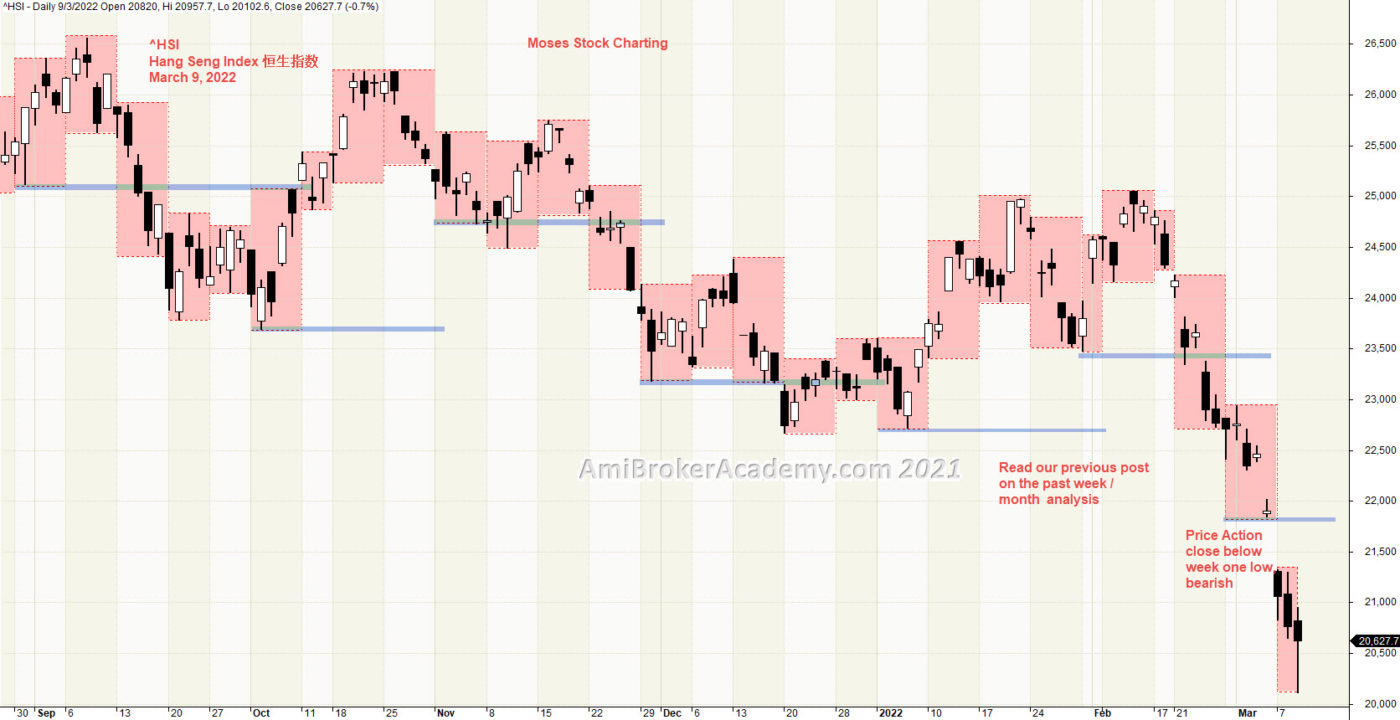
1) Hang Seng Index 恒生指数 and Week High Low
Yes, Price Action tested 2020 year low and broken. Manage your risk.
I our previous posting, we was wondering can the price action test the 2020 year low. The answer is the price action has broker the 2020 year low. Picture worth a thousand words.
Use first week high low to project the trending. You could read our past posting on Hang Seng Index on the earlier month trend analysis. In March this month, the price action has breakout and close below the week one low. Bearish for now.
In most of the US key stocks, the resistance has force the price action to close below. So, what is the Asia stocks like. Will see.
See chart.
If you are a buy and hold strategist, Will you sell now or buy now? Remember only buy near support, and sell near resistance. Wait for the price action draw near either resistance or support before action.
20220309 Hang Seng Index and Week High Low – Bearish
Moses Power Charting
Official AmiBrokerAcademy.com Charting
Disclaimer
The above result is for illustration purpose. It is meant to be used for learning buy or sell signals. We do not recommend for any particular stocks. If particular stocks of such are mentioned, they are meant as a demonstration of Amibroker as a powerful charting software. Amibroker is a charting software, it can program to scan the stocks for buy and sell signals. Or backtest for any trading strategy or technique.
We post script generated signals. Not all scan results are shown here depending on selection criterial. The MACD signal should use with price action. Users must understand what MACD and price action are all about before using them. If necessary you should attend a course to learn more on Technical Analysis (TA) and Moving Average Convergence Divergence, MACD.
Once again, the website does not guarantee any results or investment return based on the information and instruction you have read here. It should be used as learning aids only and if you decide to trade real money, all trading decision should be your own.
We learn from many past and present great traders. Kudo to these master.
Welcome to AmiBroker Academy dot com, amibrokeracademy.com.
If There is Only One Chart This is It
This is not a site that provides buy or sell signals directly. We read the stock chart bar by bar. If you understand what we read, you will get the buy or sell idea. Have fun!
Buy or Sell, you decide
Trading is very simple yet very difficult. Price is either up or down. But catch the right move is not easy. I believe many must have missed the falling knife. Now, many will be watching the topping. Can any catch the topping? Will see.
Up Down or Sideways
Trading is all probability. The price action is either 1) up, 2) down or 3) sideways.
Trade what you see. Manage your risk.
Our Believe – Buy Support Sell Resistance.
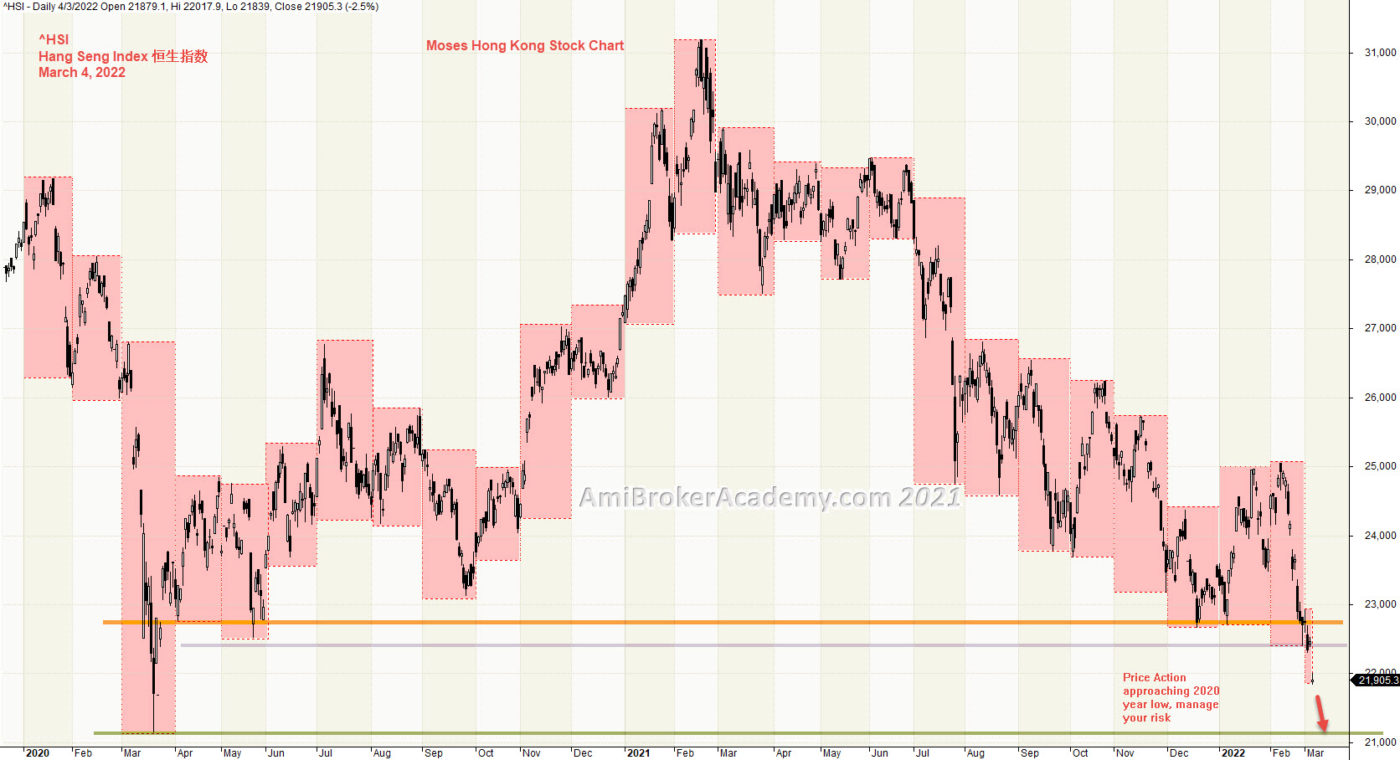
1) Hang Seng Index 恒生指数 and Month High Low
Price Action may test 2020 year low. Manage your risk.
Picture worth a thousand words. Price Action forms a lower high and lower low after price action retrace to 2021 year high. See a three drive low to bring the price action to the low. Will the low, lower than 2020 year low? Will see.
Use month high low to find important, or strong level.
See chart.
If you are a buy and hold strategist, Will you sell now or buy now? Remember only buy near support, and sell near resistance. Wait for the price action draw near either resistance or support before action.
20220304 Hang Seng Index 恒生指数 and Month High Low
Moses Power Charting
Official AmiBrokerAcademy.com Charting
Disclaimer
The above result is for illustration purpose. It is meant to be used for learning buy or sell signals. We do not recommend for any particular stocks. If particular stocks of such are mentioned, they are meant as a demonstration of Amibroker as a powerful charting software. Amibroker is a charting software, it can program to scan the stocks for buy and sell signals. Or backtest for any trading strategy or technique.
We post script generated signals. Not all scan results are shown here depending on selection criterial. The MACD signal should use with price action. Users must understand what MACD and price action are all about before using them. If necessary you should attend a course to learn more on Technical Analysis (TA) and Moving Average Convergence Divergence, MACD.
Once again, the website does not guarantee any results or investment return based on the information and instruction you have read here. It should be used as learning aids only and if you decide to trade real money, all trading decision should be your own.
We learn from many past and present great traders. Kudo to these master.
Welcome to AmiBroker Academy dot com, amibrokeracademy.com.
If There is Only One Chart This is It
This is not a site that provides buy or sell signals directly. We read the stock chart bar by bar. If you understand what we read, you will get the buy or sell idea. Have fun!
Buy or Sell, you decide
Trading is very simple yet very difficult. Price is either up or down. But catch the right move is not easy. I believe many must have missed the falling knife. Now, many will be watching the topping. Can any catch the topping? Will see.
Up Down or Sideways
Trading is all probability. The price action is either 1) up, 2) down or 3) sideways.
Trade what you see. Manage your risk.
Our Believe – Buy Support Sell Resistance.
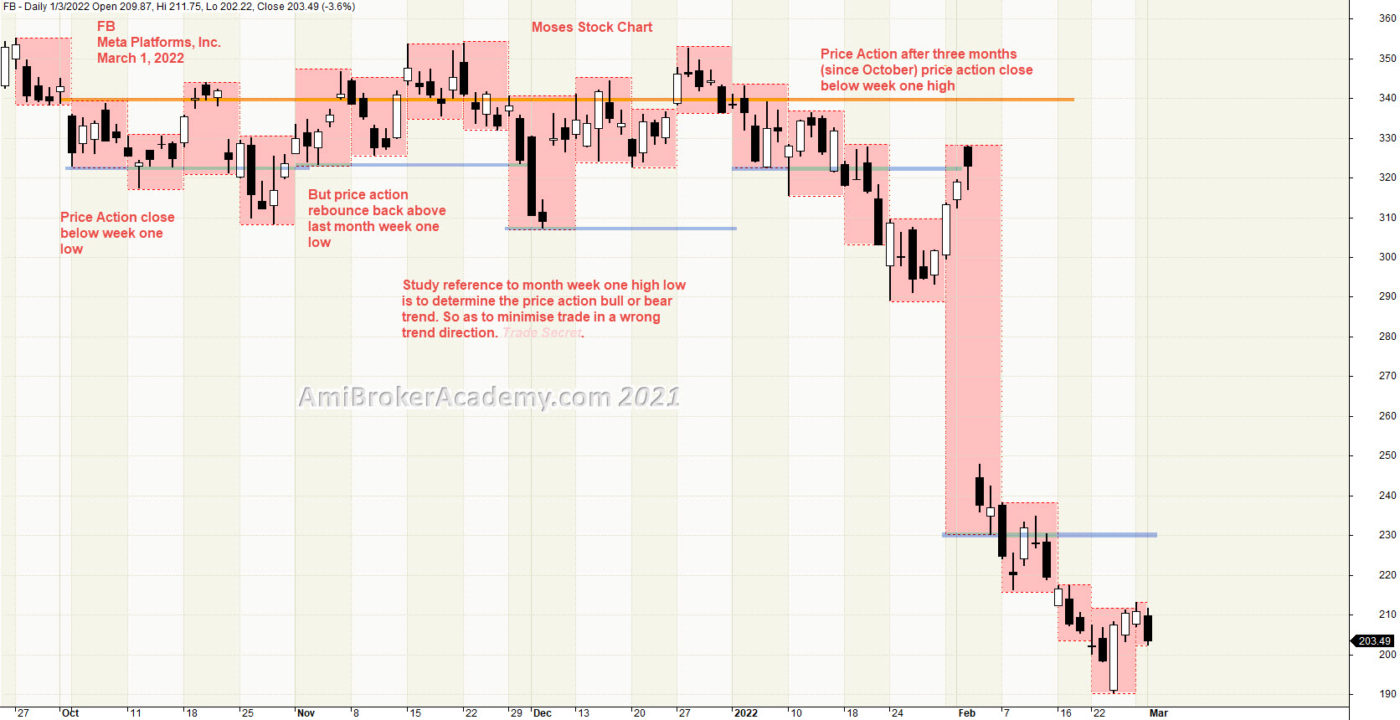
1) Meta Platforms Inc and Week High Low
Price Action zigzag for three months (since October) before close below week one high of October week one high.
Picture worth a thousand words. Price Action begin to close below four month resistance zone area. Price Action after four months still can not breakout higher mean the level very strong.
Use box can easily identify strong level, our chart here use the week high low to find great level.
See chart.
If you are a buy and hold strategist, Will you sell now or buy now? Remember only buy near support, and sell near resistance. Wait for the price action draw near either resistance or support before action.
20220301 Meta Platforms Inc and Week High Low
Moses Power Charting
Official AmiBrokerAcademy.com Charting
Disclaimer
The above result is for illustration purpose. It is meant to be used for learning buy or sell signals. We do not recommend for any particular stocks. If particular stocks of such are mentioned, they are meant as a demonstration of Amibroker as a powerful charting software. Amibroker is a charting software, it can program to scan the stocks for buy and sell signals. Or backtest for any trading strategy or technique.
We post script generated signals. Not all scan results are shown here depending on selection criterial. The MACD signal should use with price action. Users must understand what MACD and price action are all about before using them. If necessary you should attend a course to learn more on Technical Analysis (TA) and Moving Average Convergence Divergence, MACD.
Once again, the website does not guarantee any results or investment return based on the information and instruction you have read here. It should be used as learning aids only and if you decide to trade real money, all trading decision should be your own.
We learn from many past and present great traders. Kudo to these master.
Welcome to AmiBroker Academy dot com, amibrokeracademy.com.
If There is Only One Chart This is It
This is not a site that provides buy or sell signals directly. We read the stock chart bar by bar. If you understand what we read, you will get the buy or sell idea. Have fun!
Buy or Sell, you decide
Trading is very simple yet very difficult. Price is either up or down. But catch the right move is not easy. I believe many must have missed the falling knife. Now, many will be watching the topping. Can any catch the topping? Will see.
Up Down or Sideways
Trading is all probability. The price action is either 1) up, 2) down or 3) sideways.
Trade what you see. Manage your risk.
Our Believe – Buy Support Sell Resistance.
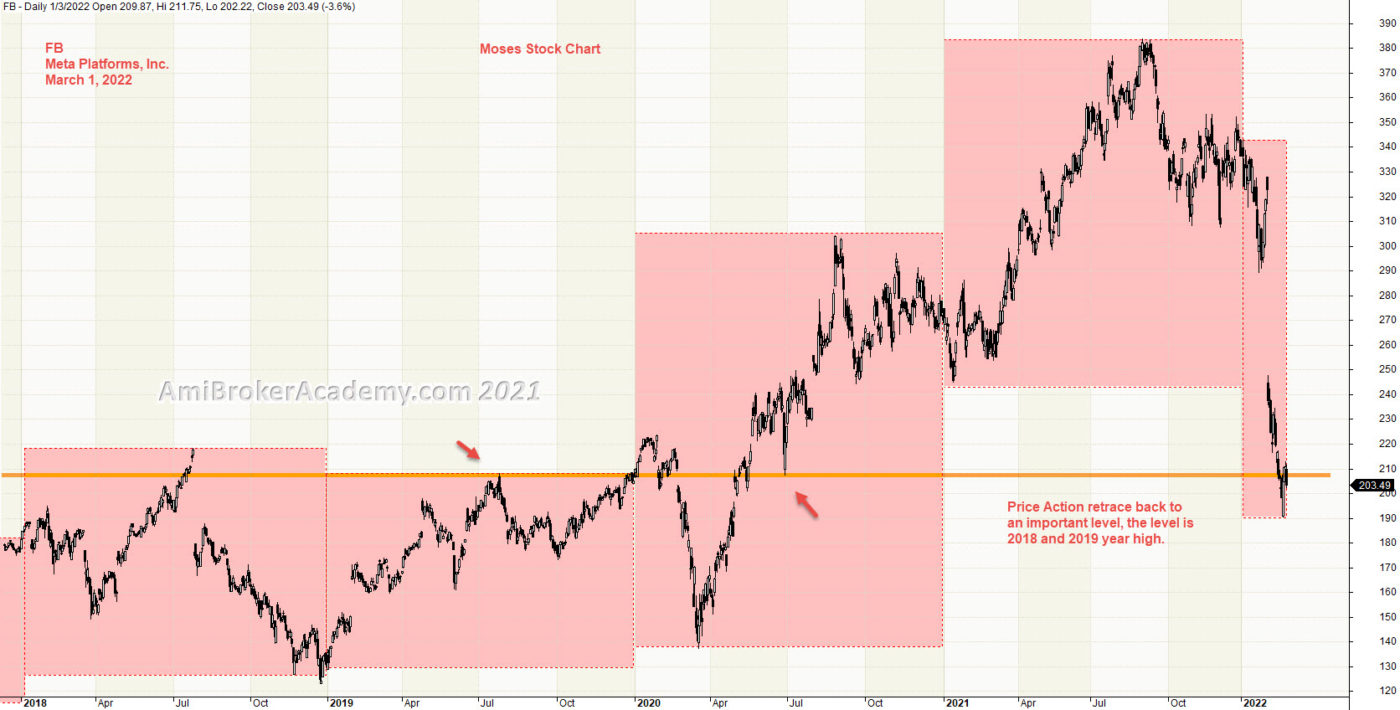
1) Meta Platforms Inc and Year High Low
Price Action now pull back to test 2018 and 2019 year high.
Picture worth a thousand words. Price Action breakout two years high and close above for two years, 2020 and 2021. Now price action pullback to retest the 2018 and 2019 year high.
Use box can easily identify strong level, our chart here use the year high low to find great level.
See chart.
If you are a buy and hold strategist, Will you sell now or buy now? Remember only buy near support, and sell near resistance. Wait for the price action draw near either resistance or support before action.
20220301 Meta Platforms Inc and Year High Low
Moses Power Charting
Official AmiBrokerAcademy.com Charting
Disclaimer
The above result is for illustration purpose. It is meant to be used for learning buy or sell signals. We do not recommend for any particular stocks. If particular stocks of such are mentioned, they are meant as a demonstration of Amibroker as a powerful charting software. Amibroker is a charting software, it can program to scan the stocks for buy and sell signals. Or backtest for any trading strategy or technique.
We post script generated signals. Not all scan results are shown here depending on selection criterial. The MACD signal should use with price action. Users must understand what MACD and price action are all about before using them. If necessary you should attend a course to learn more on Technical Analysis (TA) and Moving Average Convergence Divergence, MACD.
Once again, the website does not guarantee any results or investment return based on the information and instruction you have read here. It should be used as learning aids only and if you decide to trade real money, all trading decision should be your own.
We learn from many past and present great traders. Kudo to these master.
Welcome to AmiBroker Academy dot com, amibrokeracademy.com.
If There is Only One Chart This is It
This is not a site that provides buy or sell signals directly. We read the stock chart bar by bar. If you understand what we read, you will get the buy or sell idea. Have fun!
Buy or Sell, you decide
Trading is very simple yet very difficult. Price is either up or down. But catch the right move is not easy. I believe many must have missed the falling knife. Now, many will be watching the topping. Can any catch the topping? Will see.
Up Down or Sideways
Trading is all probability. The price action is either 1) up, 2) down or 3) sideways.
Trade what you see. Manage your risk.
Our Believe – Buy Support Sell Resistance.
1) Hang Seng Index 恒生指数 and ABCD
Price Action may test 2020 year low, support.
Picture worth a thousand words. Price Action forms a lower high and lower low after price action retrace to 2021 year high. See a three drive low.
Use the ABCD pattern, see chart, we can see price action is completing it CD leg. And it is likely to retest the 2020 year low.
See chart.
If you are a buy and hold strategist, Will you sell now or buy now? Remember only buy near support, and sell near resistance. Wait for the price action draw near either resistance or support before action.
20220224 Hang Seng Index 恒生指数 and ABCD
Moses Power Charting
Official AmiBrokerAcademy.com Charting
Disclaimer
The above result is for illustration purpose. It is meant to be used for learning buy or sell signals. We do not recommend for any particular stocks. If particular stocks of such are mentioned, they are meant as a demonstration of Amibroker as a powerful charting software. Amibroker is a charting software, it can program to scan the stocks for buy and sell signals. Or backtest for any trading strategy or technique.
We post script generated signals. Not all scan results are shown here depending on selection criterial. The MACD signal should use with price action. Users must understand what MACD and price action are all about before using them. If necessary you should attend a course to learn more on Technical Analysis (TA) and Moving Average Convergence Divergence, MACD.
Once again, the website does not guarantee any results or investment return based on the information and instruction you have read here. It should be used as learning aids only and if you decide to trade real money, all trading decision should be your own.
We learn from many past and present great traders. Kudo to these master.
Welcome to AmiBroker Academy dot com, amibrokeracademy.com.
If There is Only One Chart This is It
This is not a site that provides buy or sell signals directly. We read the stock chart bar by bar. If you understand what we read, you will get the buy or sell idea. Have fun!
Buy or Sell, you decide
Trading is very simple yet very difficult. Price is either up or down. But catch the right move is not easy. I believe many must have missed the falling knife. Now, many will be watching the topping. Can any catch the topping? Will see.
Up Down or Sideways
Trading is all probability. The price action is either 1) up, 2) down or 3) sideways.
Trade what you see. Manage your risk.
Our Believe – Buy Support Sell Resistance.
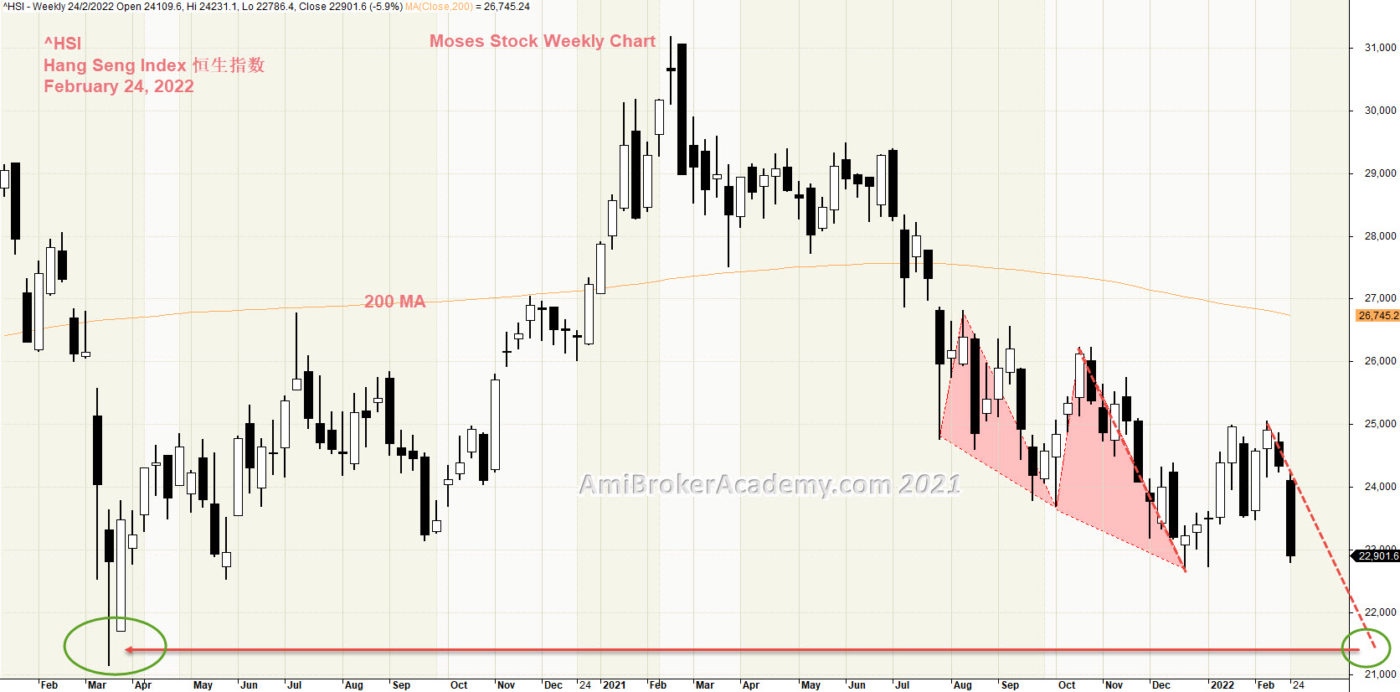
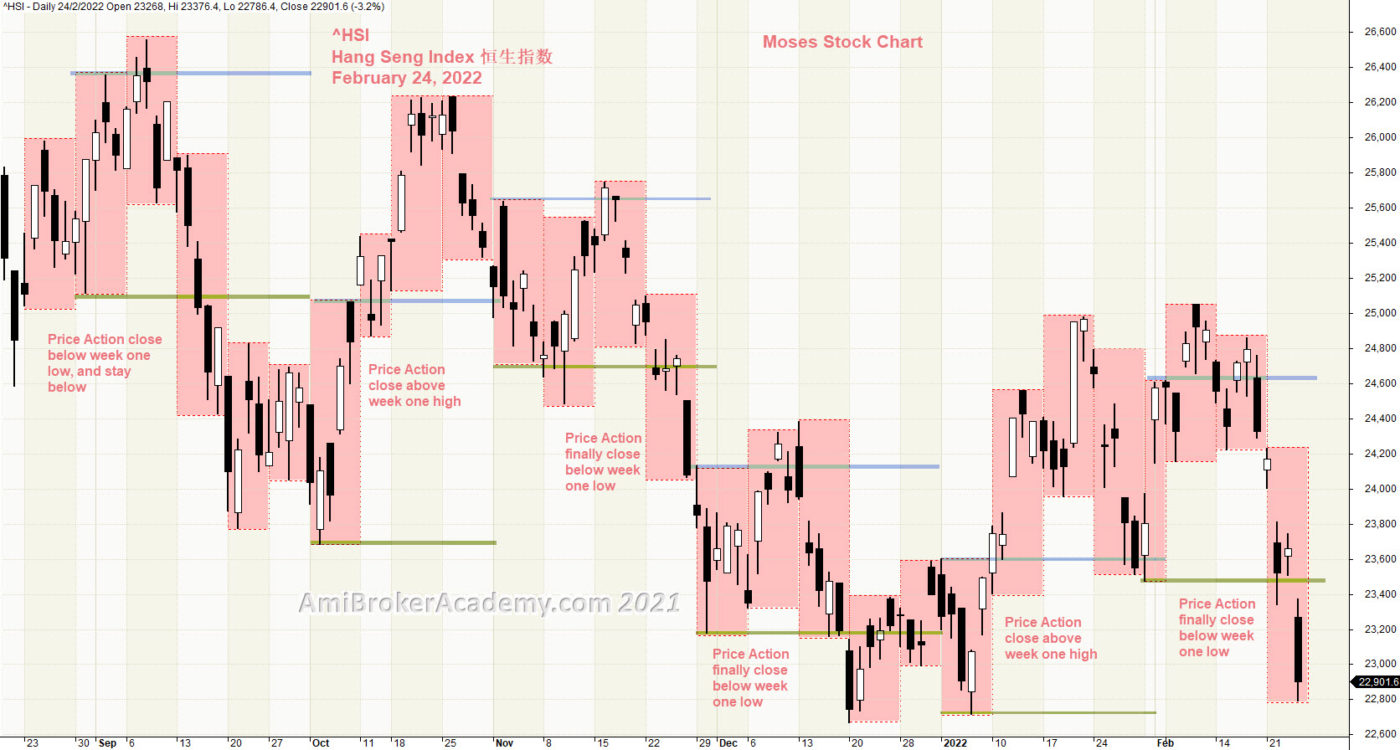
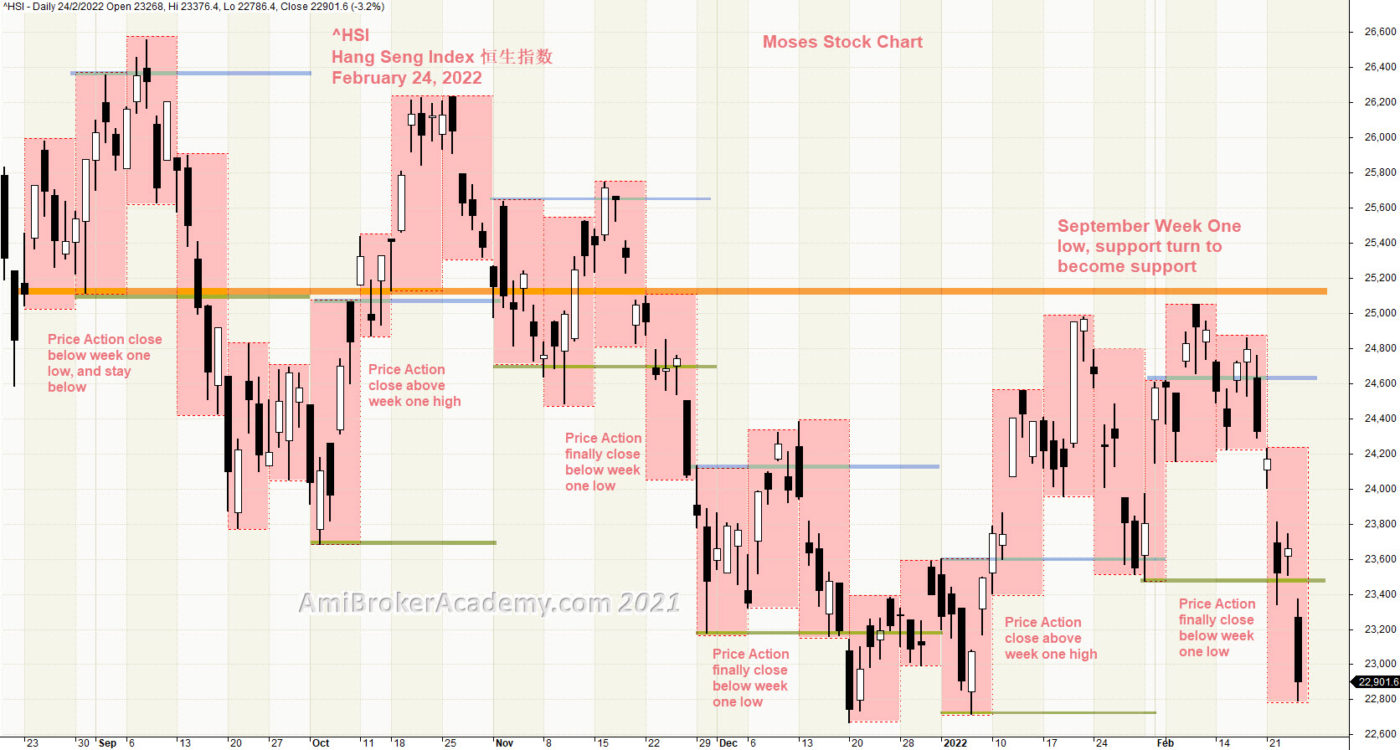
1) Hang Seng Index 恒生指数 and Weekly High Low
Price Action is currently below a strong level, below resistance.
Picture worth a thousand words. Price Action forms a lower high and lower low.
Price Action of September week one low, support turn to resistance.
Price Action continues to go lower.
See chart.
If you are a buy and hold strategist, Will you sell now or buy now? Remember only buy near support, and sell near resistance. Wait for the price action draw near either resistance or support before action.
20220224 Hang Seng Index 恒生指数 and Weekly High Low20220224 Hang Seng Index 恒生指数 and Weekly High Low
Moses Power Charting
Official AmiBrokerAcademy.com Charting
Disclaimer
The above result is for illustration purpose. It is meant to be used for learning buy or sell signals. We do not recommend for any particular stocks. If particular stocks of such are mentioned, they are meant as a demonstration of Amibroker as a powerful charting software. Amibroker is a charting software, it can program to scan the stocks for buy and sell signals. Or backtest for any trading strategy or technique.
We post script generated signals. Not all scan results are shown here depending on selection criterial. The MACD signal should use with price action. Users must understand what MACD and price action are all about before using them. If necessary you should attend a course to learn more on Technical Analysis (TA) and Moving Average Convergence Divergence, MACD.
Once again, the website does not guarantee any results or investment return based on the information and instruction you have read here. It should be used as learning aids only and if you decide to trade real money, all trading decision should be your own.
We learn from many past and present great traders. Kudo to these master.
Welcome to AmiBroker Academy dot com, amibrokeracademy.com.
If There is Only One Chart This is It
This is not a site that provides buy or sell signals directly. We read the stock chart bar by bar. If you understand what we read, you will get the buy or sell idea. Have fun!
Buy or Sell, you decide
Trading is very simple yet very difficult. Price is either up or down. But catch the right move is not easy. I believe many must have missed the falling knife. Now, many will be watching the topping. Can any catch the topping? Will see.
Up Down or Sideways
Trading is all probability. The price action is either 1) up, 2) down or 3) sideways.
Trade what you see. Manage your risk.
Our Believe – Buy Support Sell Resistance.
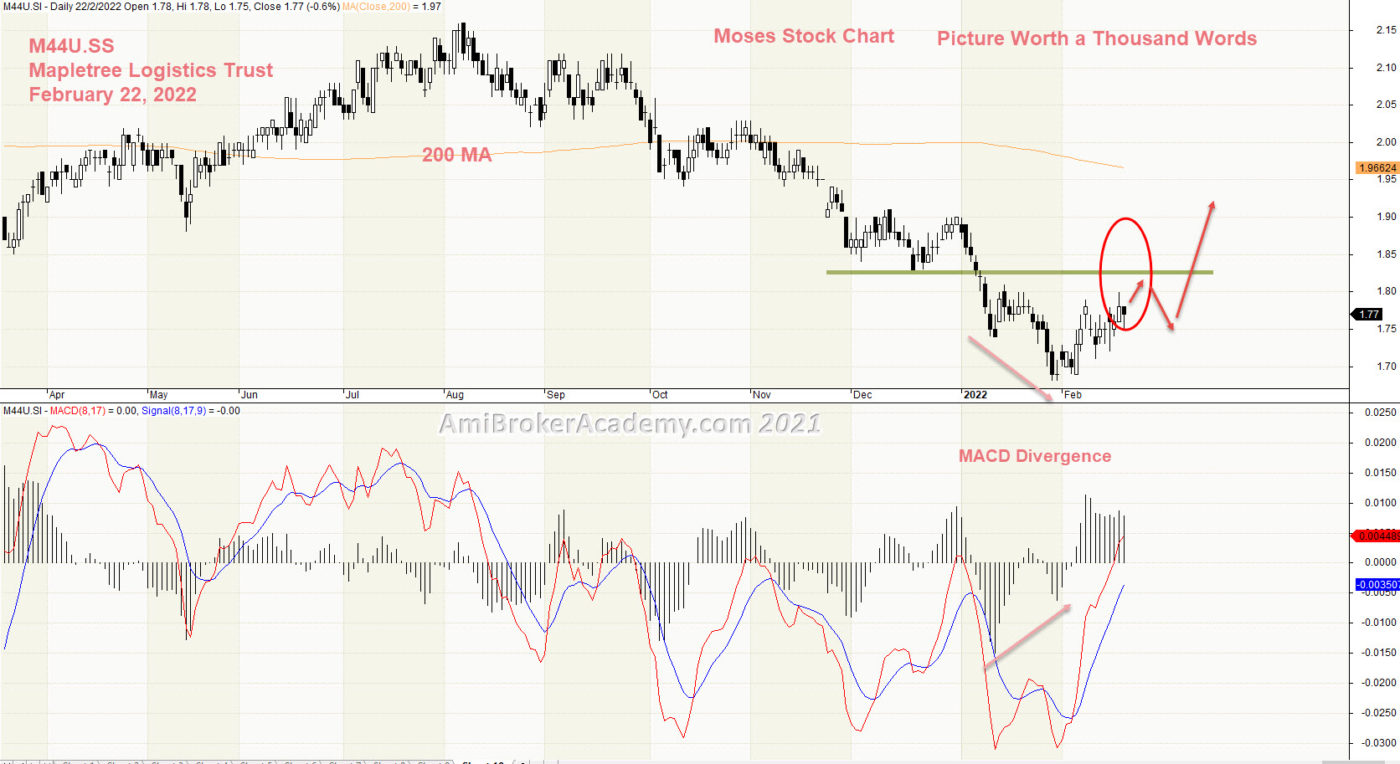
Mapletree Logistics Trust and MACD Diver
1) Mapletree Logistics Trust and MACD Divergence
Picture worth a thousand words. MACD shows a divergence, when price action forms a lower high, but MACD-H forms a higher low. This indicates the price action strength is begin to become stronger.
When you spot a MACD Divergence, it is wise to monitor the the price action retrace. So, if the price action begin to close higher near a resistance or trendline, it is a good idea to look for confirmation for entry.
Watch out for a pull trap!
See chart. Price Action is likely to test the resistance.
If you are a buy and hold strategist, Will you sell now or buy now? Remember only buy near support, and sell near resistance. Wait for the price action draw near either resistance or support before action.
20220222 Mapletree Logistics Trust and MACD Divergence
Moses Power Charting
Official AmiBrokerAcademy.com Charting
Disclaimer
The above result is for illustration purpose. It is meant to be used for learning buy or sell signals. We do not recommend for any particular stocks. If particular stocks of such are mentioned, they are meant as a demonstration of Amibroker as a powerful charting software. Amibroker is a charting software, it can program to scan the stocks for buy and sell signals. Or backtest for any trading strategy or technique.
We post script generated signals. Not all scan results are shown here depending on selection criterial. The MACD signal should use with price action. Users must understand what MACD and price action are all about before using them. If necessary you should attend a course to learn more on Technical Analysis (TA) and Moving Average Convergence Divergence, MACD.
Once again, the website does not guarantee any results or investment return based on the information and instruction you have read here. It should be used as learning aids only and if you decide to trade real money, all trading decision should be your own.
We learn from many past and present great traders. Kudo to these master.
Welcome to AmiBroker Academy dot com, amibrokeracademy.com.
If There is Only One Chart This is It
This is not a site that provides buy or sell signals directly. We read the stock chart bar by bar. If you understand what we read, you will get the buy or sell idea. Have fun!
Buy or Sell, you decide
Trading is very simple yet very difficult. Price is either up or down. But catch the right move is not easy. I believe many must have missed the falling knife. Now, many will be watching the topping. Can any catch the topping? Will see.
Up Down or Sideways
Trading is all probability. The price action is either up, down or sideways.
Trade what you see. Manage your risk.
Our Believe – Buy Support Sell Resistance.
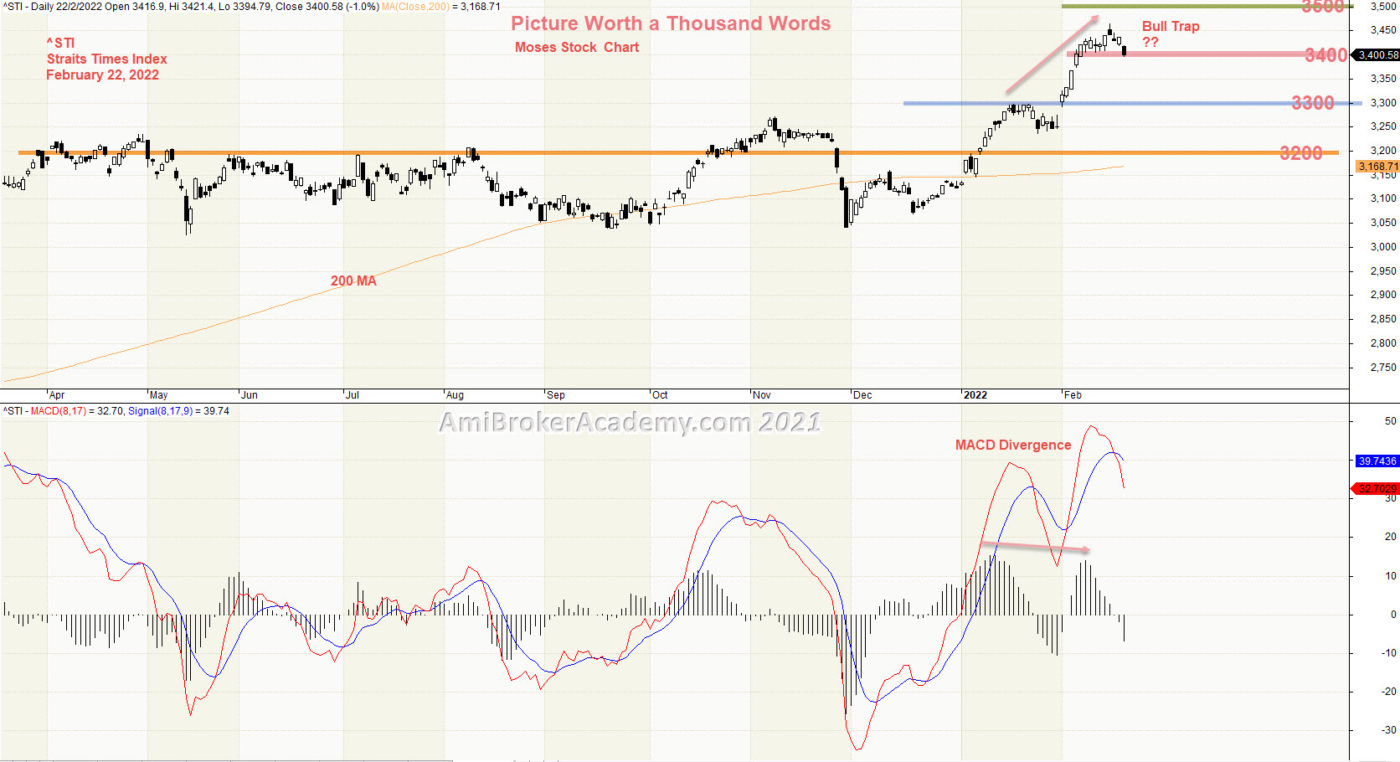
1) Straits Times Index and MACD
Picture worth a thousand words. MACD shows a divergence, when price action forms a higher high, but MACD-H forms a lower high. This indicates the price action strength is starting to become weaker.
When you spot a MACD Divergence, it is wise to monitor the the price action pullback. So, if the price action begin to close below the trendline, it is a good idea to take some profit, in other words the money on the table.
Watch out for a pull trap!
See chart. Price Action is likely hitting theresistance.
If you are a buy and hold strategist, Will you sell now or buy now? Remember only buy near support, and sell near resistance. Wait for the price action draw near either resistance or support before action.
20220222 Straits Times Index and MACD
Moses Power Charting
Official AmiBrokerAcademy.com Charting
Disclaimer
The above result is for illustration purpose. It is meant to be used for learning buy or sell signals. We do not recommend for any particular stocks. If particular stocks of such are mentioned, they are meant as a demonstration of Amibroker as a powerful charting software. Amibroker is a charting software, it can program to scan the stocks for buy and sell signals. Or backtest for any trading strategy or technique.
We post script generated signals. Not all scan results are shown here depending on selection criterial. The MACD signal should use with price action. Users must understand what MACD and price action are all about before using them. If necessary you should attend a course to learn more on Technical Analysis (TA) and Moving Average Convergence Divergence, MACD.
Once again, the website does not guarantee any results or investment return based on the information and instruction you have read here. It should be used as learning aids only and if you decide to trade real money, all trading decision should be your own.
We learn from many past and present great traders. Kudo to these master.
Welcome to AmiBroker Academy dot com, amibrokeracademy.com.
If There is Only One Chart This is It
This is not a site that provides buy or sell signals directly. We read the stock chart bar by bar. If you understand what we read, you will get the buy or sell idea. Have fun!
Buy or Sell, you decide
Trading is very simple yet very difficult. Price is either up or down. But catch the right move is not easy. I believe many must have missed the falling knife. Now, many will be watching the topping. Can any catch the topping? Will see.
Up Down or Sideways
Trading is all probability. The price action is either up, down or sideways.
Trade what you see. Manage your risk.
Our Believe – Buy Support Sell Resistance.
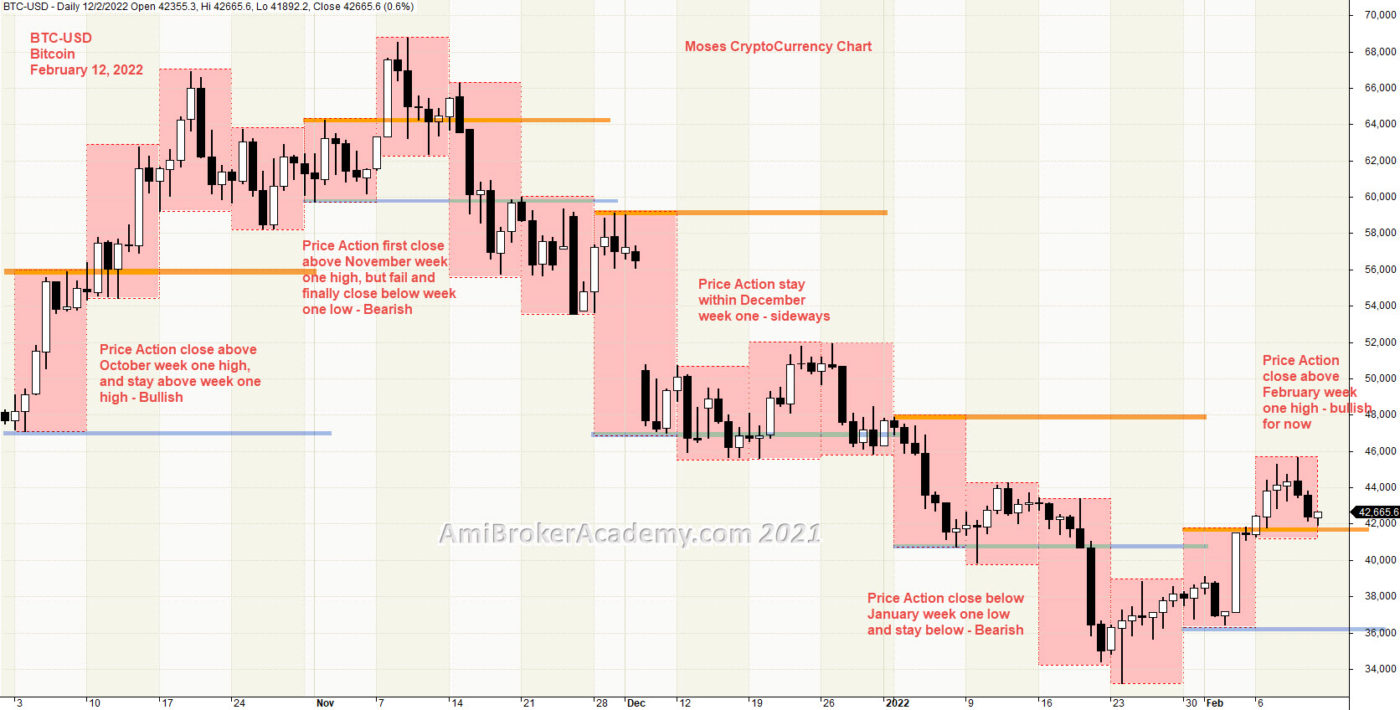
1) Bitcoin Cryptocurrency Week High Low
Picture worth a thousand words. To see the price action from a different perspective than MACD divergence. We study price action week high low. From the week high low from October, reference to the each month week one, we see the bull and bear trend.
When you spot a MACD Divergence, it is wise to monitor the the price action pullback. So, if the price action begin to close below the trendline, it is a good idea to take some profit, in other words the money on the table.
See chart. Price Action now go below October week one low, and stay below. We could also identify the price action is now resisted by October week one low. Only until the price action breakout, and close above the support, the price action may continue to stay below October week one low. Manage you risk.
If you are a buy and hold strategist, Will you sell now or buy now? Remember only buy near support, and sell near resistance.
February 12, 2022 Bitcoin Cryptocurrency Week High Low
Moses Power Charting
Official AmiBrokerAcademy.com Charting
Disclaimer
The above result is for illustration purpose. It is meant to be used for learning buy or sell signals. We do not recommend for any particular stocks. If particular stocks of such are mentioned, they are meant as a demonstration of Amibroker as a powerful charting software. Amibroker is a charting software, it can program to scan the stocks for buy and sell signals. Or backtest for any trading strategy or technique.
We post script generated signals. Not all scan results are shown here depending on selection criterial. The MACD signal should use with price action. Users must understand what MACD and price action are all about before using them. If necessary you should attend a course to learn more on Technical Analysis (TA) and Moving Average Convergence Divergence, MACD.
Once again, the website does not guarantee any results or investment return based on the information and instruction you have read here. It should be used as learning aids only and if you decide to trade real money, all trading decision should be your own.
We learn from many past and present great traders. Kudo to these master.