Welcome to AmiBroker Academy dot com, amibrokeracademy.com.
If There is Only One Chart This is It
Moses Power Stock Chart.
We Believe – Buy Support or Sell Resistance.
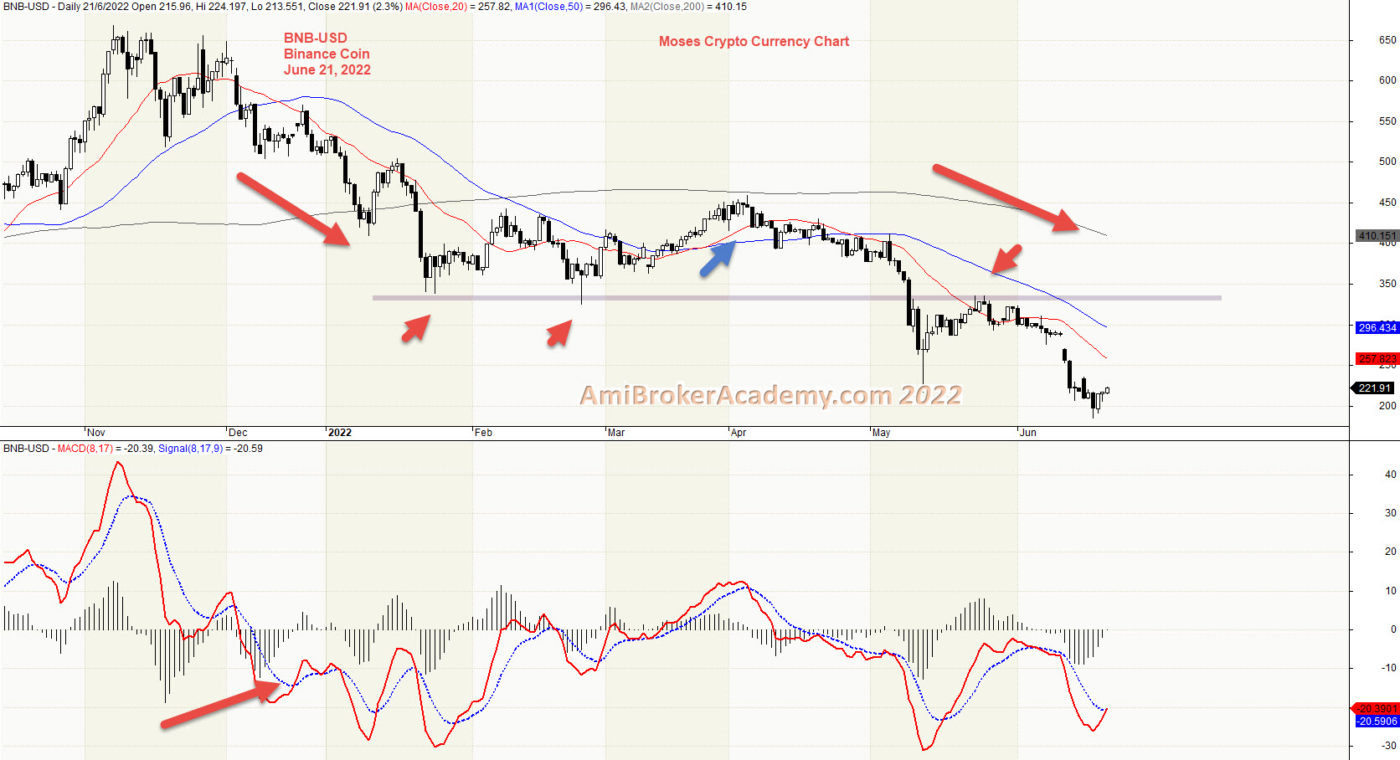
1) Binance Coin Cryptocurrency and MACD
Price Action reflect the market emotions, it factor in news, buy or sell emotions.
Price Action after tested the peak in 2021 November, and begin to drift south. Price Action pullback in April this year, but fail to continue, see chart.
Now the price action continue to breakout below a strong level.
If you are a buy and hold strategist, Will you sell now or buy now? Remember only buy near support, and sell near resistance. Wait for the price action draw near either resistance or support before action.
Think Think got more Things
In trading, some predict the up or down on the trend. Here, we look for support, strong support to buy. Or take profit when price action test the resistance.
20220621 Binance Coin Crypto and MACD
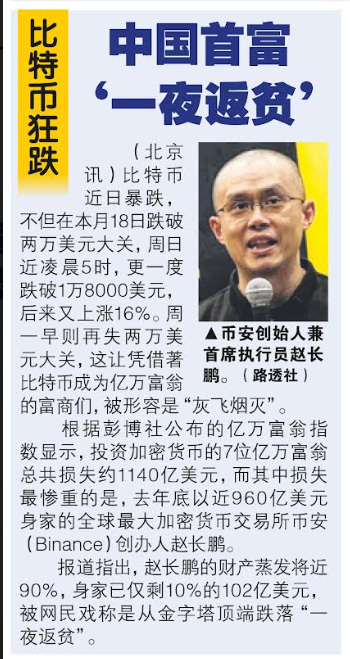
Binance Crypto Founder
Changpeng Zhao, commonly known as “CZ”, is a Chinese-Canadian business executive. Zhao is the founder and CEO of Binance, the world’s largest cryptocurrency exchange by trading volume as of April 2018. CZ was born in Jiangsu, China and moved to Canada at a young age with his family. He is currently based in Singapore.
Recently, the News reported (in Chinese), CZ has lost 90% of his financial asset, and left 10.2 billion dollars.
Moses Power Charting
Official AmiBrokerAcademy.com Charting
Disclaimer
The above result is for illustration purpose. It is meant to be used for learning buy or sell signals. We do not recommend for any particular stocks. If particular stocks of such are mentioned, they are meant as a demonstration of Amibroker as a powerful charting software. Amibroker is a charting software, it can program to scan the stocks for buy and sell signals. Or backtest for any trading strategy or technique.
We post script generated signals. Not all scan results are shown here depending on selection criterial. The MACD signal should use with price action. Users must understand what MACD and price action are all about before using them. If necessary you should attend a course to learn more on Technical Analysis (TA) and Moving Average Convergence Divergence, MACD.
Once again, the website does not guarantee any results or investment return based on the information and instruction you have read here. It should be used as learning aids only and if you decide to trade real money, all trading decision should be your own.
We learn from many past and present great traders. Kudo to these master.
Welcome to AmiBroker Academy dot com, amibrokeracademy.com.
If There is Only One Chart This is It
Moses Power Stock Chart.
We Believe – Buy Support or Sell Resistance.
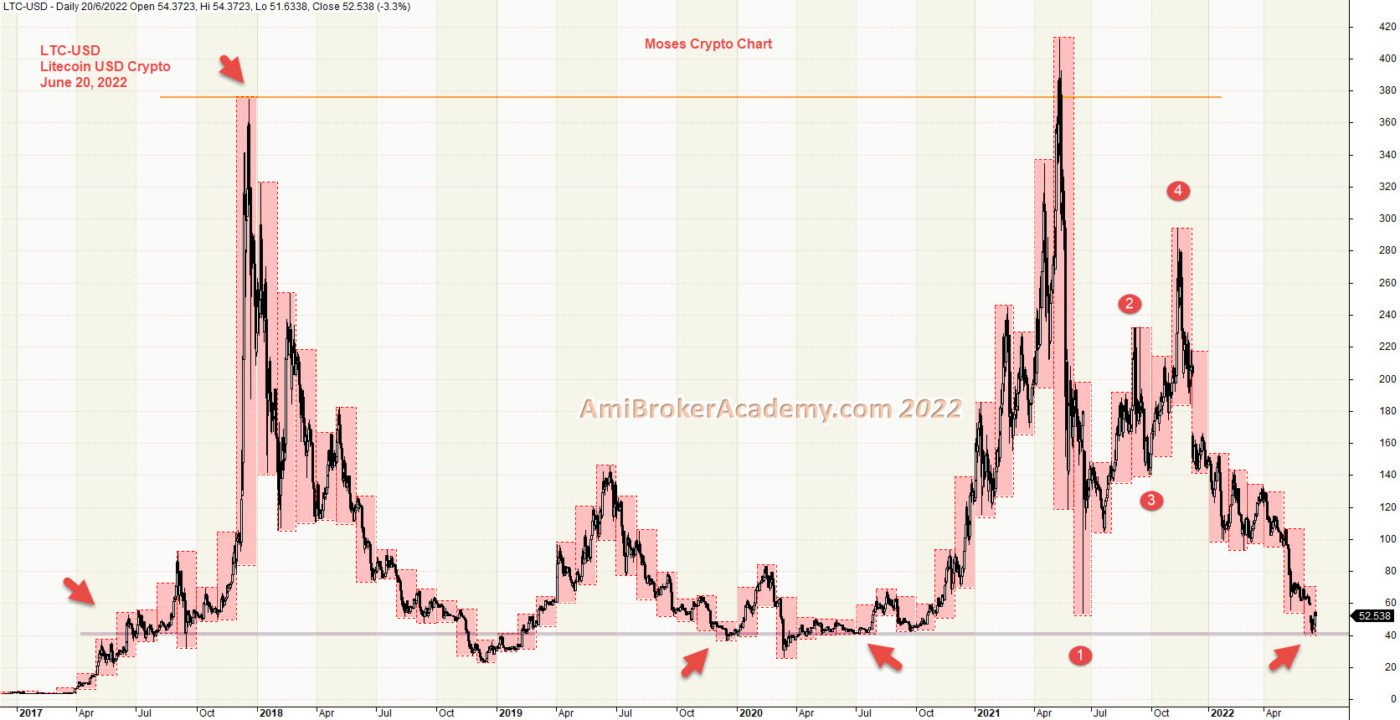
1) Litecoin USD Cryptocurrency and Month High Low
Price Action reflect the market emotions, it factor in news, buy or sell emotions.
Price Action after breakout above 2016 year high in 2021, and begin to drift south. Price Action pullback to nearly hitting the strong level near 40 dollars, see chart.
And follow a 1234 pattern to rebounce. After the second peak in 2021, the price action begin to drift south again. This time the price action supported by the strong level, see chart.
Is it time to buy as supported by the strong level?
If you are a buy and hold strategist, Will you sell now or buy now? Remember only buy near support, and sell near resistance. Wait for the price action draw near either resistance or support before action.
Think Think got more Things
In trading, some predict the up or down on the trend. Here, we look for support, strong support to buy. Or take profit when price action test the resistance.
20220620 Litecoin USD Cryptocurrency and Month High Low
Moses Power Charting
Official AmiBrokerAcademy.com Charting
Disclaimer
The above result is for illustration purpose. It is meant to be used for learning buy or sell signals. We do not recommend for any particular stocks. If particular stocks of such are mentioned, they are meant as a demonstration of Amibroker as a powerful charting software. Amibroker is a charting software, it can program to scan the stocks for buy and sell signals. Or backtest for any trading strategy or technique.
We post script generated signals. Not all scan results are shown here depending on selection criterial. The MACD signal should use with price action. Users must understand what MACD and price action are all about before using them. If necessary you should attend a course to learn more on Technical Analysis (TA) and Moving Average Convergence Divergence, MACD.
Once again, the website does not guarantee any results or investment return based on the information and instruction you have read here. It should be used as learning aids only and if you decide to trade real money, all trading decision should be your own.
We learn from many past and present great traders. Kudo to these master.
Welcome to AmiBroker Academy dot com, amibrokeracademy.com.
If There is Only One Chart This is It
Moses Power Stock Chart.
We Believe – Buy Support or Sell Resistance.
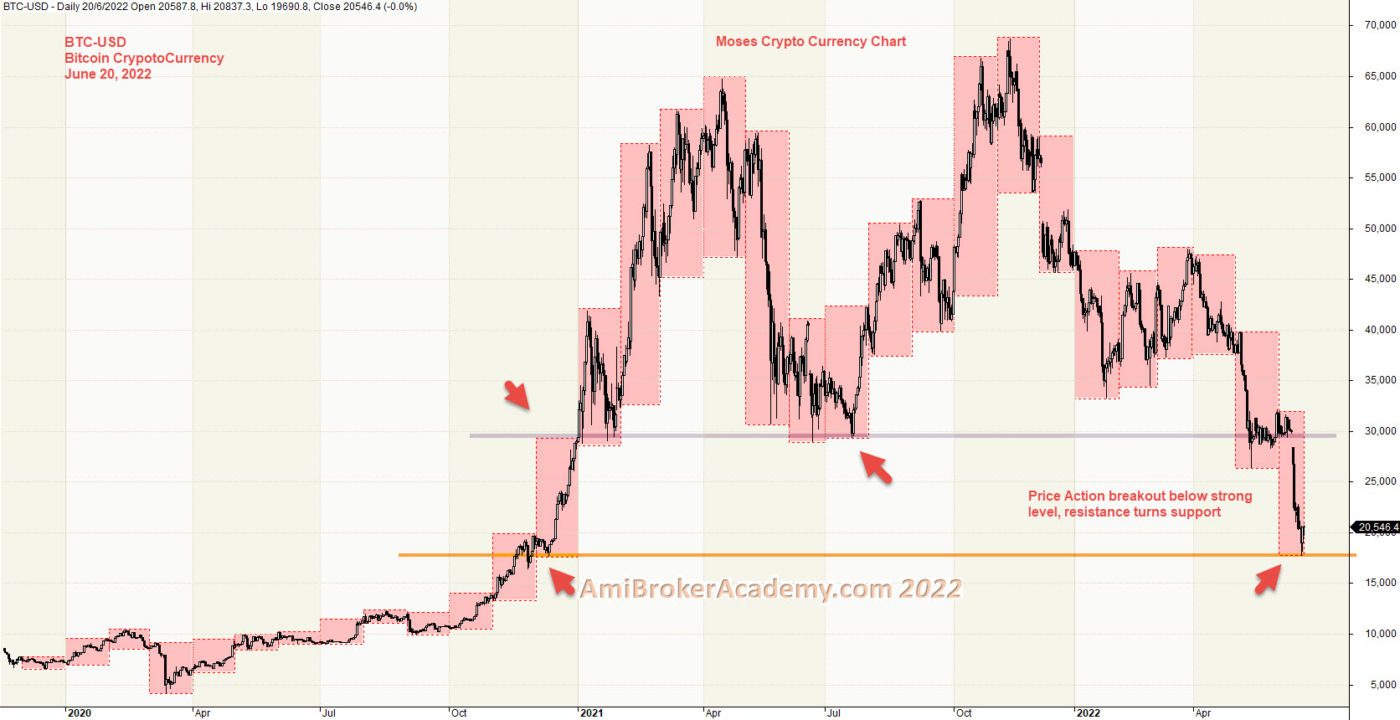
1) BTC-USD Bitcoin Crypto Month High Low
Price Action reflect the market emotions, it factor in news, buy or sell emotions.
Price Action is below a strong level, and price action continue to fall. Price Action is currently supported by resistance turns support.
Is the price low enough to buy?
If you are a buy and hold strategist, Will you sell now or buy now? Remember only buy near support, and sell near resistance. Wait for the price action draw near either resistance or support before action.
Think Think got more Things
In trading, some predict the up or down on the trend. Here, we look for support, strong support to buy. Or take profit when price action test the resistance.
20220620 BTC Bitcoin and Month High Low
Moses Power Charting
Official AmiBrokerAcademy.com Charting
Disclaimer
The above result is for illustration purpose. It is meant to be used for learning buy or sell signals. We do not recommend for any particular stocks. If particular stocks of such are mentioned, they are meant as a demonstration of Amibroker as a powerful charting software. Amibroker is a charting software, it can program to scan the stocks for buy and sell signals. Or backtest for any trading strategy or technique.
We post script generated signals. Not all scan results are shown here depending on selection criterial. The MACD signal should use with price action. Users must understand what MACD and price action are all about before using them. If necessary you should attend a course to learn more on Technical Analysis (TA) and Moving Average Convergence Divergence, MACD.
Once again, the website does not guarantee any results or investment return based on the information and instruction you have read here. It should be used as learning aids only and if you decide to trade real money, all trading decision should be your own.
We learn from many past and present great traders. Kudo to these master.
Welcome to AmiBroker Academy dot com, amibrokeracademy.com.
If There is Only One Chart This is It
Moses Power Stock Chart.
We Believe – Buy Support or Sell Resistance.
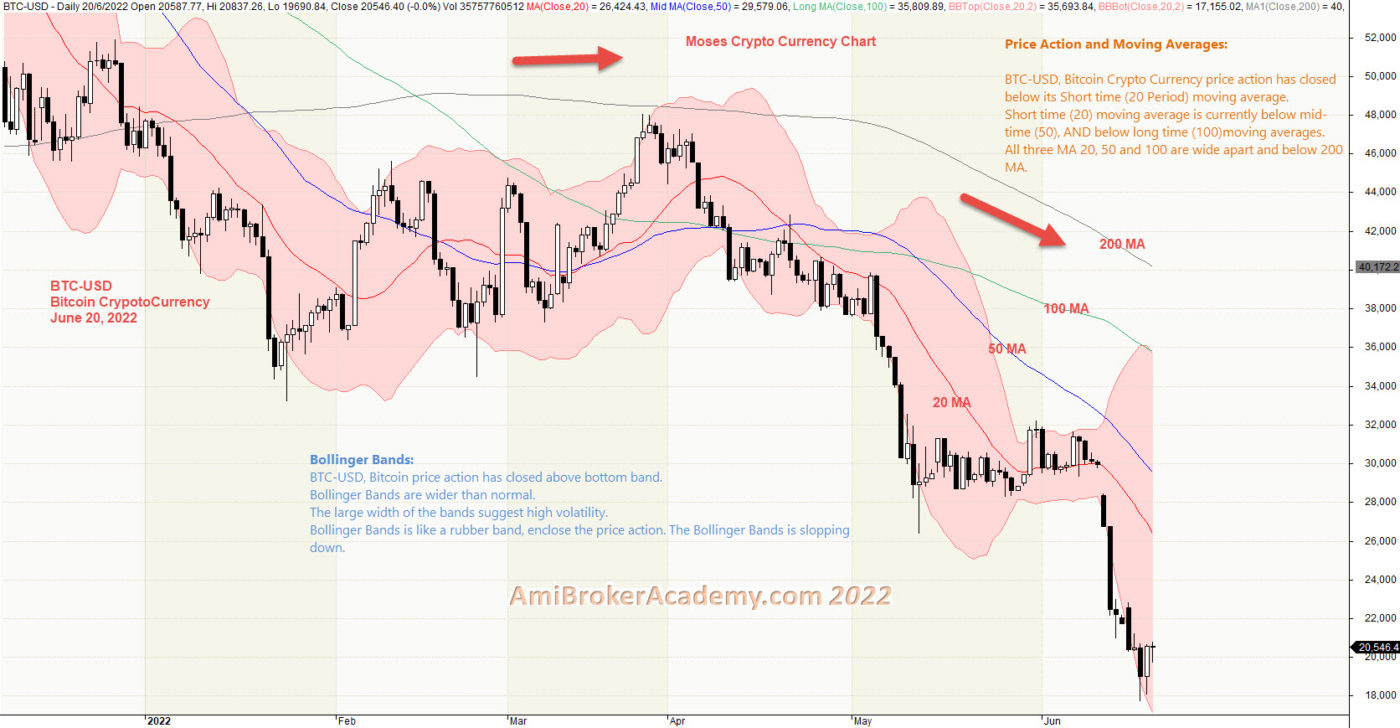
1) BTC-USD Bitcoin Bollinger Bands and Moving Averages
Price Action reflect the market emotions, it factor in news, buy or sell emotions.
Moving Averages is great visual tool, when fast MA below slow MA, the price action is bearish bias. Currently, the 20 MA, is below 50 MA and 50 MA is below 100 MA. And all three, 20, 50 and 100 MA are below 200 MA. Four MAs are wide apart, the trend is very bearish.
Bollinger Bands is a like a rubber bands enclosed the price action. When band is wide open, the market is more volatile.
We shall study a bigger view on the Bitcoin market emotions.
If you are a buy and hold strategist, Will you sell now or buy now? Remember only buy near support, and sell near resistance. Wait for the price action draw near either resistance or support before action.
Think Think got more Things
In trading, some predict the up or down on the trend. Here, we look for support, strong support to buy. Or take profit when price action test the resistance.
20220620 BTC Bitcoin Bollinger Bands and Moving Averages
Moses Power Charting
Official AmiBrokerAcademy.com Charting
Disclaimer
The above result is for illustration purpose. It is meant to be used for learning buy or sell signals. We do not recommend for any particular stocks. If particular stocks of such are mentioned, they are meant as a demonstration of Amibroker as a powerful charting software. Amibroker is a charting software, it can program to scan the stocks for buy and sell signals. Or backtest for any trading strategy or technique.
We post script generated signals. Not all scan results are shown here depending on selection criterial. The MACD signal should use with price action. Users must understand what MACD and price action are all about before using them. If necessary you should attend a course to learn more on Technical Analysis (TA) and Moving Average Convergence Divergence, MACD.
Once again, the website does not guarantee any results or investment return based on the information and instruction you have read here. It should be used as learning aids only and if you decide to trade real money, all trading decision should be your own.
We learn from many past and present great traders. Kudo to these master.
Welcome to AmiBroker Academy dot com, amibrokeracademy.com.
If There is Only One Chart This is It
Moses Power Stock Chart.
We Believe – Buy Support or Sell Resistance.
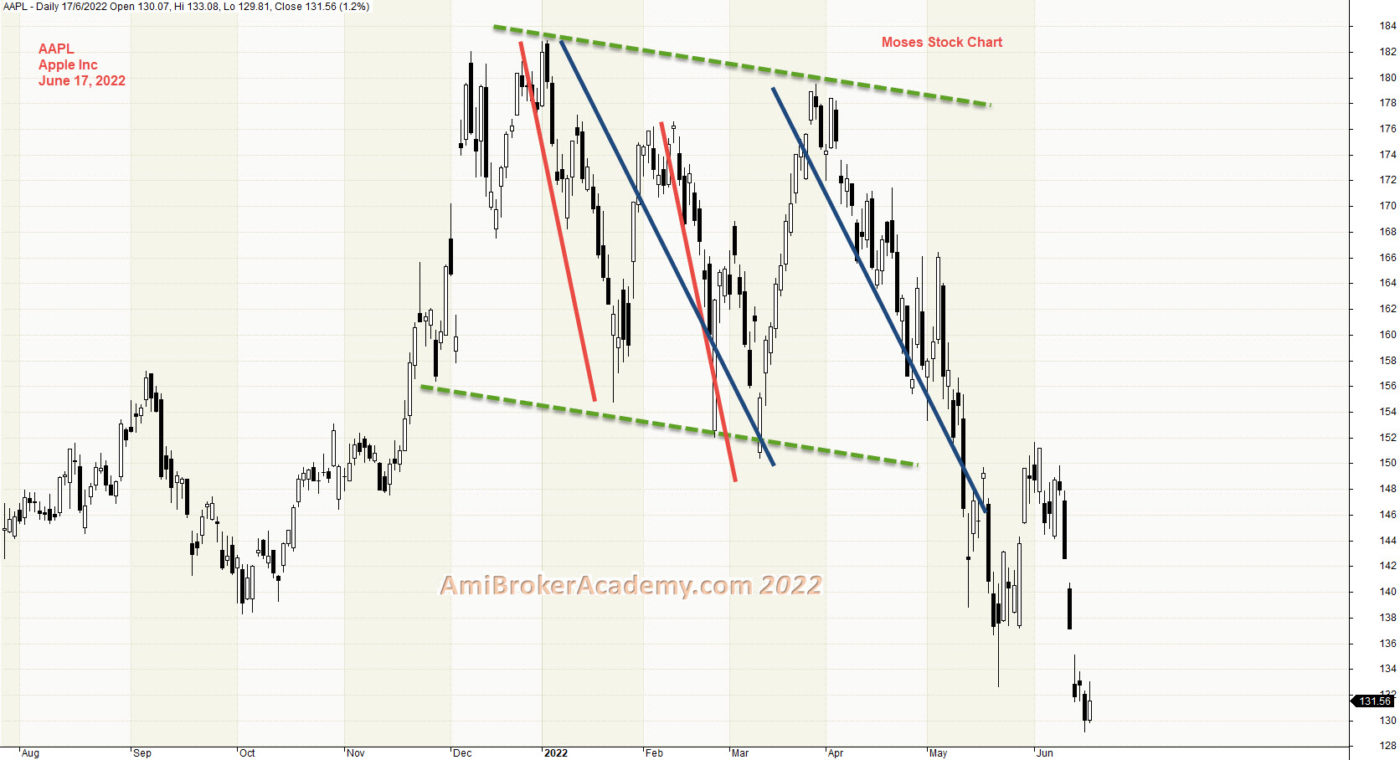
1) Apple Inc and Equal Distance Channel
Look again, will the fall stop. Stop by which support. Will see.
Price Action reflect the market emotions, it factor in news, buy or sell emotions.
Price Action fail to move higher and begin to form lower high. Connect two high and copy and paste the low, forms the equal distance channel. You can also spot the wave pattern, AB=CD, price action now back to lower channel, will the fall did not stop. It breakout below the lower channel and pullback to be resisted by lower channel. The price action resisted by lower channel and fall further.
If you are a buy and hold strategist, Will you sell now or buy now? Remember only buy near support, and sell near resistance. Wait for the price action draw near either resistance or support before action.
Think Think got more Things
In trading, some predict the up or down on the trend. Here, we look for support, strong support to buy. Or take profit when price action test the resistance.
20220617 Apple Inc and Equal Distance Channel
Moses Power Charting
Official AmiBrokerAcademy.com Charting
Disclaimer
The above result is for illustration purpose. It is meant to be used for learning buy or sell signals. We do not recommend for any particular stocks. If particular stocks of such are mentioned, they are meant as a demonstration of Amibroker as a powerful charting software. Amibroker is a charting software, it can program to scan the stocks for buy and sell signals. Or backtest for any trading strategy or technique.
We post script generated signals. Not all scan results are shown here depending on selection criterial. The MACD signal should use with price action. Users must understand what MACD and price action are all about before using them. If necessary you should attend a course to learn more on Technical Analysis (TA) and Moving Average Convergence Divergence, MACD.
Once again, the website does not guarantee any results or investment return based on the information and instruction you have read here. It should be used as learning aids only and if you decide to trade real money, all trading decision should be your own.
We learn from many past and present great traders. Kudo to these master.
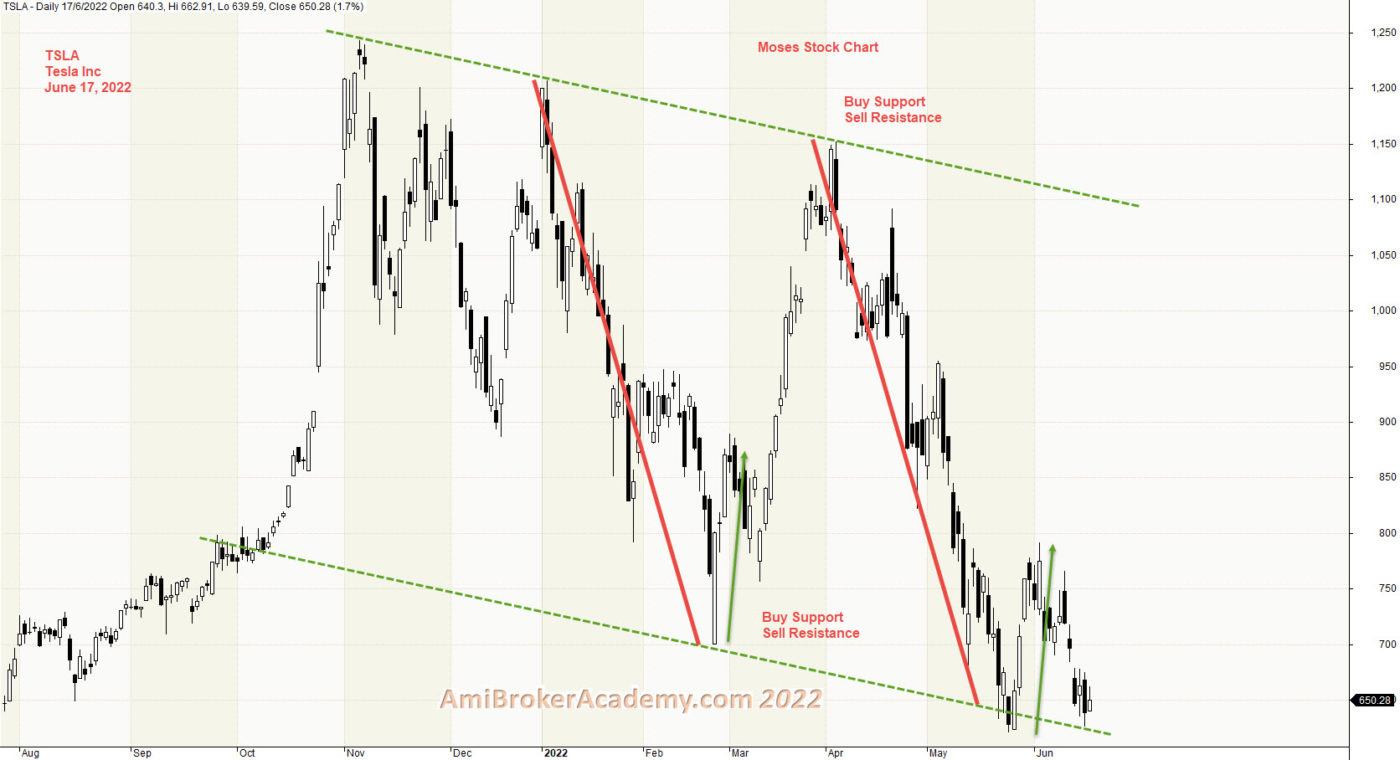
Price Action reflect the market emotions, it factor in news, buy or sell emotions.
Price Action fail to move higher and begin to form lower high. Connect two high and copy and paste the low, forms the equal distance channel. You can also spot the wave pattern, AB=CD, price action now back to lower channel again, will the fall stop. Will see.
If you are a buy and hold strategist, Will you sell now or buy now? Remember only buy near support, and sell near resistance. Wait for the price action draw near either resistance or support before action.
Think Think got more Things
In trading, some predict the up or down on the trend. Here, we look for support, strong support to buy. Or take profit when price action test the resistance.
20220617 Tesla Inc and Equal Distancec Channel
Moses Power Charting
Official AmiBrokerAcademy.com Charting
Disclaimer
The above result is for illustration purpose. It is meant to be used for learning buy or sell signals. We do not recommend for any particular stocks. If particular stocks of such are mentioned, they are meant as a demonstration of Amibroker as a powerful charting software. Amibroker is a charting software, it can program to scan the stocks for buy and sell signals. Or backtest for any trading strategy or technique.
We post script generated signals. Not all scan results are shown here depending on selection criterial. The MACD signal should use with price action. Users must understand what MACD and price action are all about before using them. If necessary you should attend a course to learn more on Technical Analysis (TA) and Moving Average Convergence Divergence, MACD.
Once again, the website does not guarantee any results or investment return based on the information and instruction you have read here. It should be used as learning aids only and if you decide to trade real money, all trading decision should be your own.
We learn from many past and present great traders. Kudo to these master.
Price Action reflect the market emotions, it factor in news, buy or sell emotions.
Price Action fail to move higher and begin to form lower high. Connect two high and copy and paste the low, forms the equal distance channel. You can also spot the wave pattern, AB=CD, price action now is breakout below lower channel, will the fall continue. Will see.
If you are a buy and hold strategist, Will you sell now or buy now? Remember only buy near support, and sell near resistance. Wait for the price action draw near either resistance or support before action.
Think Think got more Things
In trading, some predict the up or down on the trend. Here, we look for support, strong support to buy. Or take profit when price action test the resistance.
20220617 Apple Inc and Equal Distance Channel
Moses Power Charting
Official AmiBrokerAcademy.com Charting
Disclaimer
The above result is for illustration purpose. It is meant to be used for learning buy or sell signals. We do not recommend for any particular stocks. If particular stocks of such are mentioned, they are meant as a demonstration of Amibroker as a powerful charting software. Amibroker is a charting software, it can program to scan the stocks for buy and sell signals. Or backtest for any trading strategy or technique.
We post script generated signals. Not all scan results are shown here depending on selection criterial. The MACD signal should use with price action. Users must understand what MACD and price action are all about before using them. If necessary you should attend a course to learn more on Technical Analysis (TA) and Moving Average Convergence Divergence, MACD.
Once again, the website does not guarantee any results or investment return based on the information and instruction you have read here. It should be used as learning aids only and if you decide to trade real money, all trading decision should be your own.
We learn from many past and present great traders. Kudo to these master.
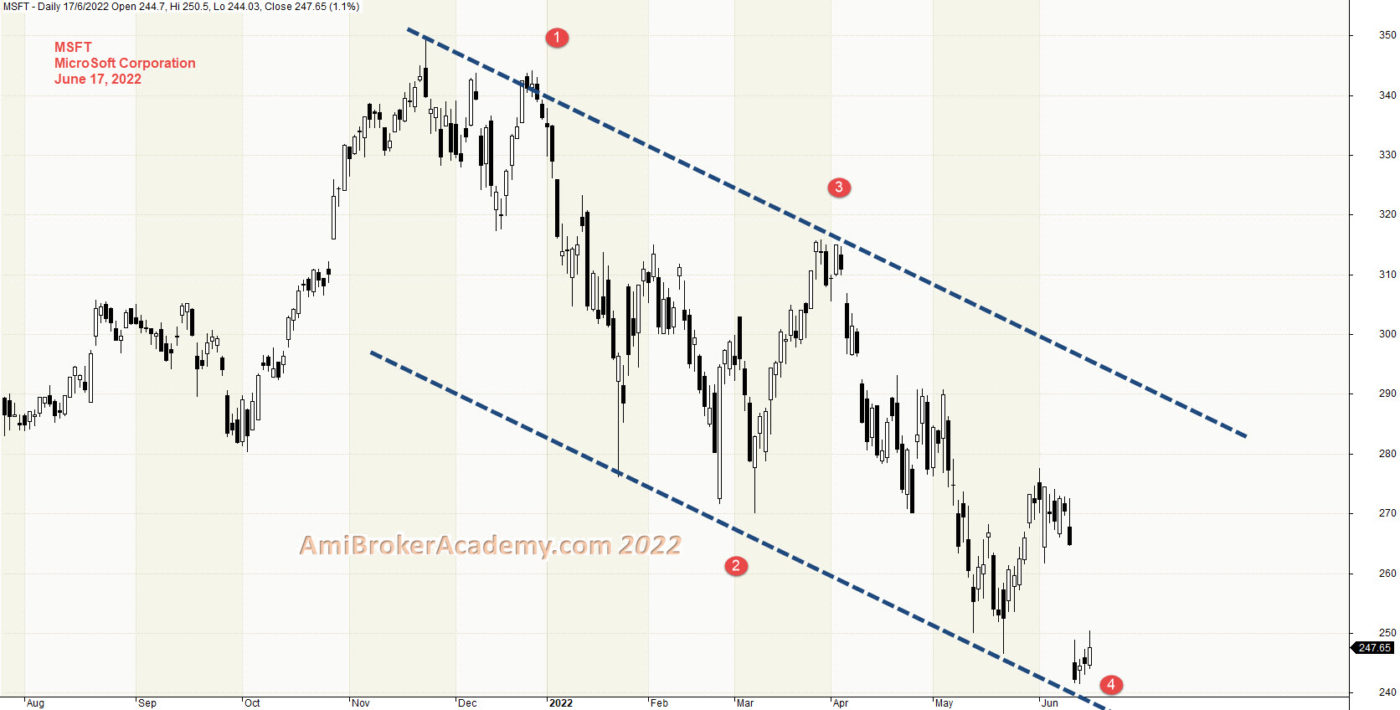
Price Action reflect the market emotions, it factor in news, buy or sell emotions.
Price Action fail to move higher and begin to form lower high. Connect two high and copy and paste the low, forms the equal distance channel. You can also spot the wave pattern, 1234, price action now is at the lower channel, will the support react. Wait for confirmation before act.
If you are a buy and hold strategist, Will you sell now or buy now? Remember only buy near support, and sell near resistance. Wait for the price action draw near either resistance or support before action.
Think Think got more Things
In trading, some predict the up or down on the trend. Here, we look for support, strong support to buy. Or take profit when price action test the resistance.
20220617 MicroSoft Corporation and ABCD Wave Pattern
Moses Power Charting
Official AmiBrokerAcademy.com Charting
Disclaimer
The above result is for illustration purpose. It is meant to be used for learning buy or sell signals. We do not recommend for any particular stocks. If particular stocks of such are mentioned, they are meant as a demonstration of Amibroker as a powerful charting software. Amibroker is a charting software, it can program to scan the stocks for buy and sell signals. Or backtest for any trading strategy or technique.
We post script generated signals. Not all scan results are shown here depending on selection criterial. The MACD signal should use with price action. Users must understand what MACD and price action are all about before using them. If necessary you should attend a course to learn more on Technical Analysis (TA) and Moving Average Convergence Divergence, MACD.
Once again, the website does not guarantee any results or investment return based on the information and instruction you have read here. It should be used as learning aids only and if you decide to trade real money, all trading decision should be your own.
We learn from many past and present great traders. Kudo to these master.
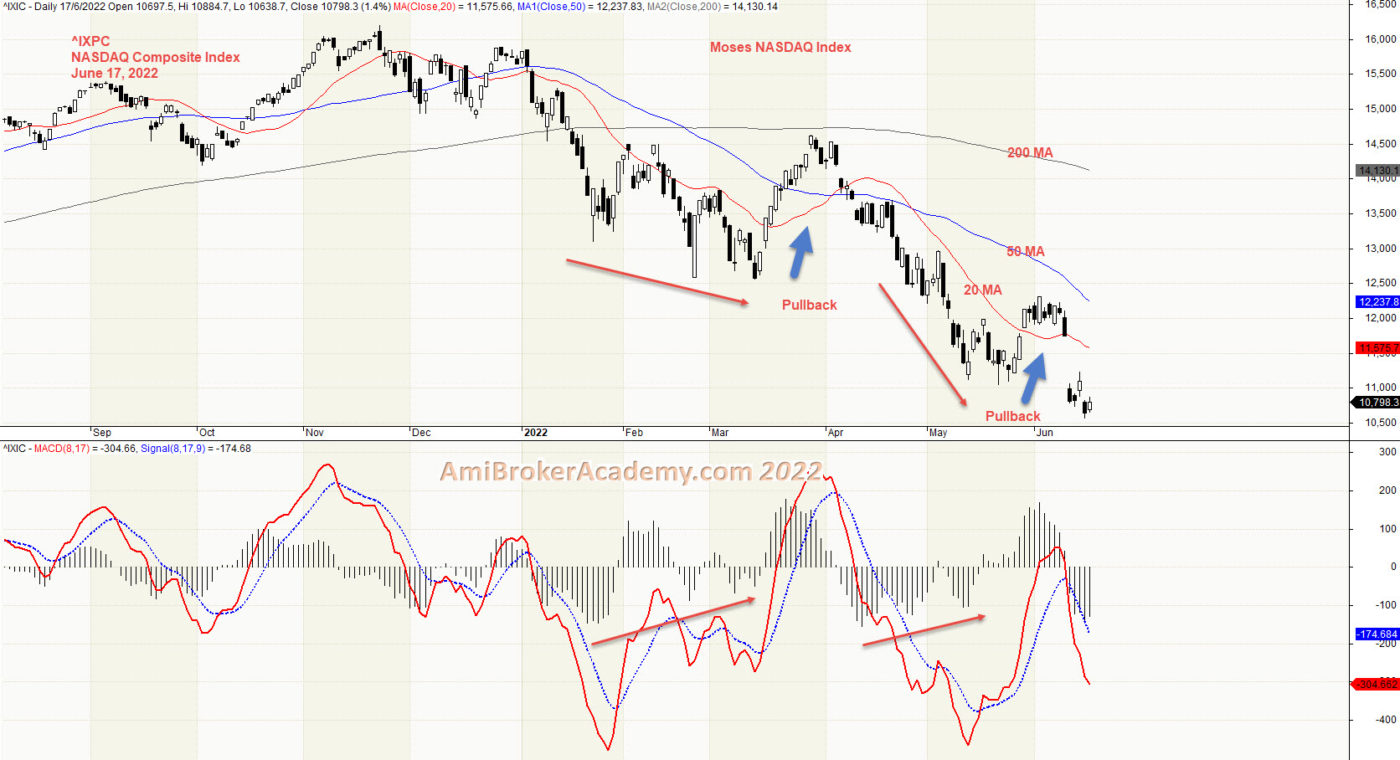
Price Action reflect the market emotions, it factor in news, buy or sell emotions.
Moving Average is a great visual aid. And MACD is a great and easy to understand indicator. When MACD Divergence happen, there is a possibility that the price action may change in direction. So, a pullback is always possible. But, remember, you don’t stop at every traffic light. Therefore, the pullback may not really happen of big enough.
If you are a buy and hold strategist, Will you sell now or buy now? Remember only buy near support, and sell near resistance. Wait for the price action draw near either resistance or support before action.
Think Think got more Things
In trading, some predict the up or down on the trend. Here, we look for support, strong support to buy. Or take profit when price action test the resistance.
Moses Power Charting
20220617 NASDAQ Index and MACD
Official AmiBrokerAcademy.com Charting
Disclaimer
The above result is for illustration purpose. It is meant to be used for learning buy or sell signals. We do not recommend for any particular stocks. If particular stocks of such are mentioned, they are meant as a demonstration of Amibroker as a powerful charting software. Amibroker is a charting software, it can program to scan the stocks for buy and sell signals. Or backtest for any trading strategy or technique.
We post script generated signals. Not all scan results are shown here depending on selection criterial. The MACD signal should use with price action. Users must understand what MACD and price action are all about before using them. If necessary you should attend a course to learn more on Technical Analysis (TA) and Moving Average Convergence Divergence, MACD.
Once again, the website does not guarantee any results or investment return based on the information and instruction you have read here. It should be used as learning aids only and if you decide to trade real money, all trading decision should be your own.
We learn from many past and present great traders. Kudo to these master.
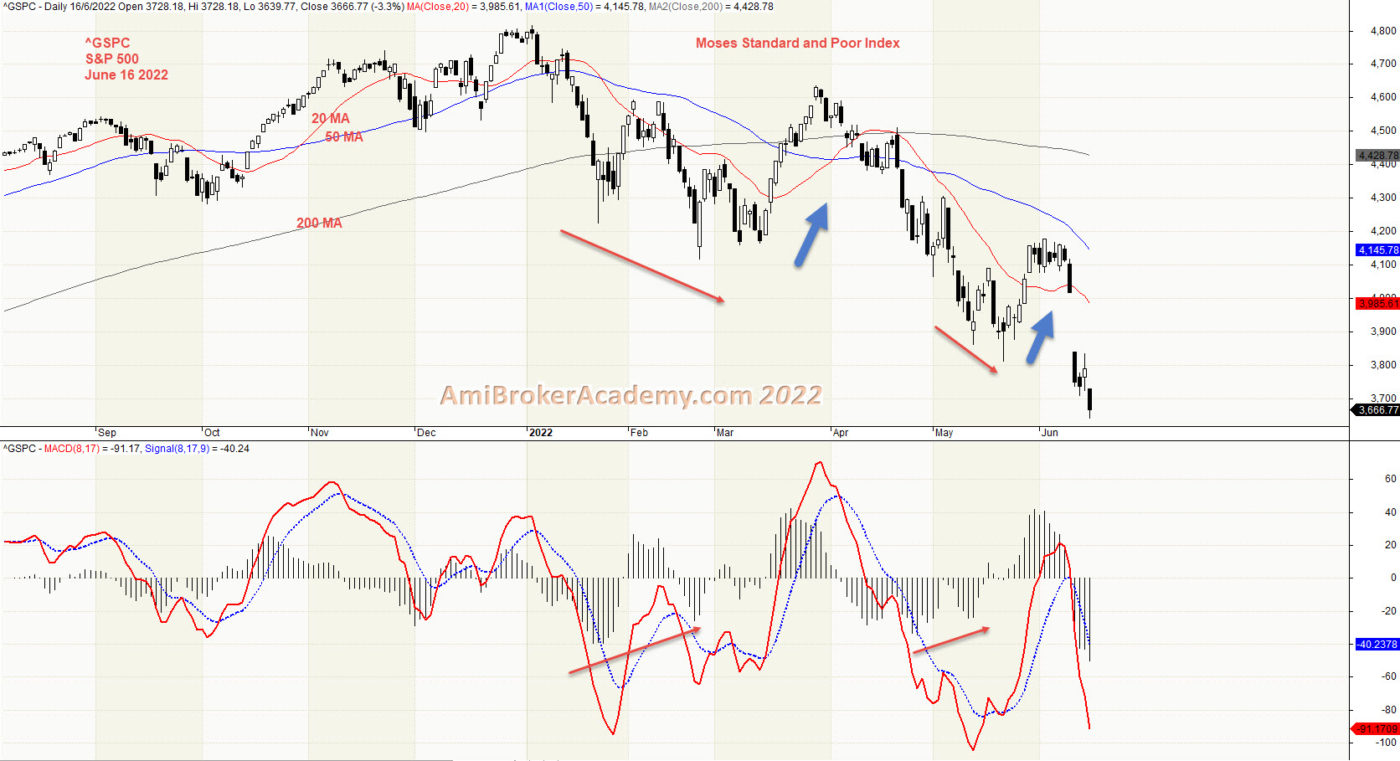
Price Action reflect the market emotions, it factor in news, buy or sell emotions.
Moving Average is a great visual aid. And MACD is a great and easy to understand indicator. When MACD Divergence happen, there is a possibility that the price action may change in direction. So, a pullback is always possible. But, remember, you don’t stop at every traffic light. Therefore, the pullback may not really happen of big enough.
If you are a buy and hold strategist, Will you sell now or buy now? Remember only buy near support, and sell near resistance. Wait for the price action draw near either resistance or support before action.
Think Think got more Things
In trading, some predict the up or down on the trend. Here, we look for support, strong support to buy. Or take profit when price action test the resistance.
20220616 S&P 500 Index and MACD
Moses Power Charting Moses Index
Official AmiBrokerAcademy.com Charting
Disclaimer
The above result is for illustration purpose. It is meant to be used for learning buy or sell signals. We do not recommend for any particular stocks. If particular stocks of such are mentioned, they are meant as a demonstration of Amibroker as a powerful charting software. Amibroker is a charting software, it can program to scan the stocks for buy and sell signals. Or backtest for any trading strategy or technique.
We post script generated signals. Not all scan results are shown here depending on selection criterial. The MACD signal should use with price action. Users must understand what MACD and price action are all about before using them. If necessary you should attend a course to learn more on Technical Analysis (TA) and Moving Average Convergence Divergence, MACD.
Once again, the website does not guarantee any results or investment return based on the information and instruction you have read here. It should be used as learning aids only and if you decide to trade real money, all trading decision should be your own.
We learn from many past and present great traders. Kudo to these master.
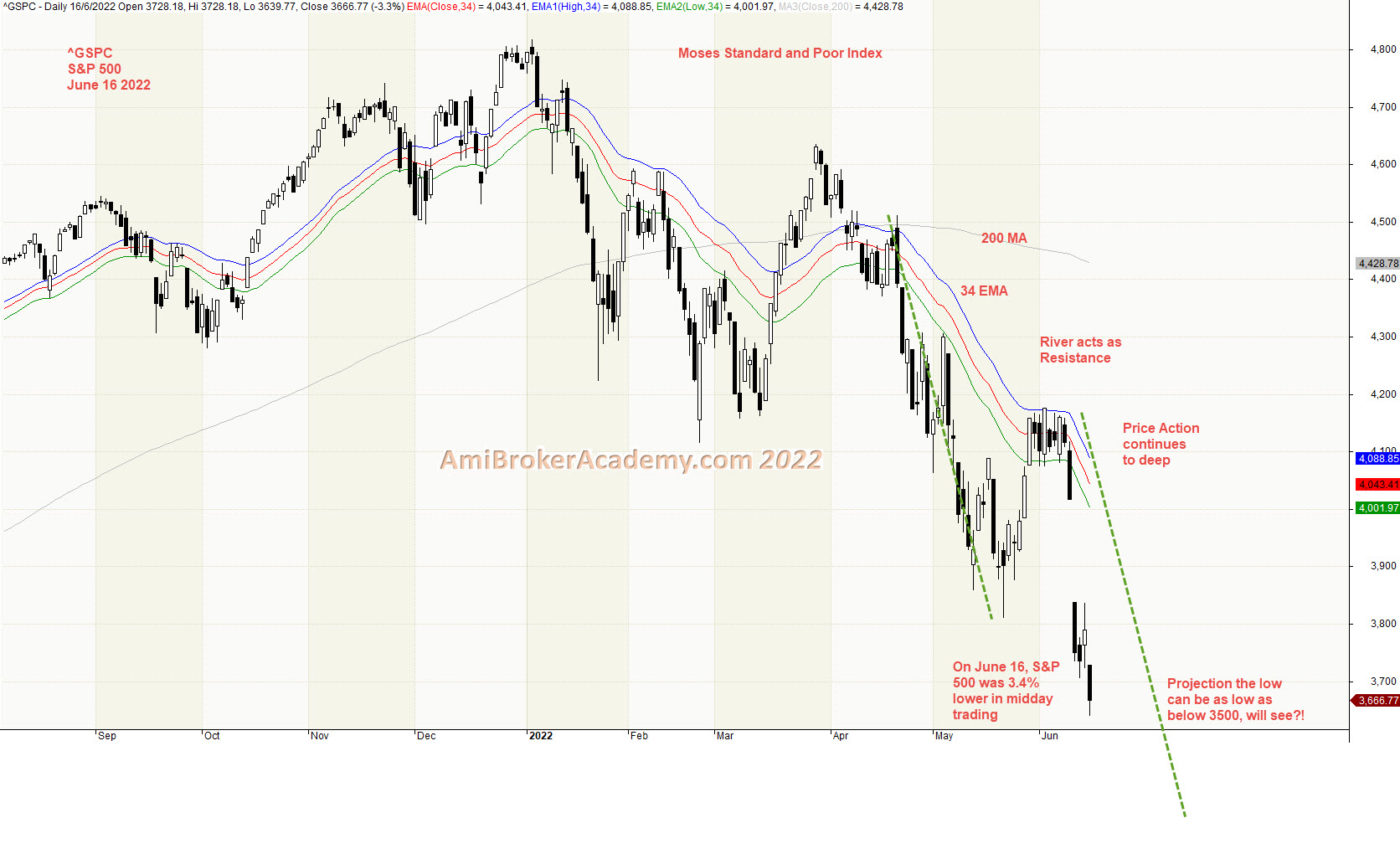
Price Action reflect the market emotions, it factor in news, buy or sell emotions.
Moving Average is a great visual aid. When the MA slops down, and price action close below the MA, the trend is likely bearish. The reverse is bullish. Raghee instead of using one MA, she use three the same MA, but, high, low and close. It forms a band or River. This gives a even better visual effect.
River is slopping down from start of 2022, and continues to point downward.
From a Gartley wave pattern, the trend is down. It could goes as low as below 3500 points. Manage your risk.
If you are a buy and hold strategist, Will you sell now or buy now? Remember only buy near support, and sell near resistance. Wait for the price action draw near either resistance or support before action.
Think Think got more Things
In trading, some predict the up or down on the trend. Here, we look for support, strong support to buy. Or take profit when price action test the resistance.
20220616 S&P 500 Index and River
Moses Power Charting Moses Index
Official AmiBrokerAcademy.com Charting
Disclaimer
The above result is for illustration purpose. It is meant to be used for learning buy or sell signals. We do not recommend for any particular stocks. If particular stocks of such are mentioned, they are meant as a demonstration of Amibroker as a powerful charting software. Amibroker is a charting software, it can program to scan the stocks for buy and sell signals. Or backtest for any trading strategy or technique.
We post script generated signals. Not all scan results are shown here depending on selection criterial. The MACD signal should use with price action. Users must understand what MACD and price action are all about before using them. If necessary you should attend a course to learn more on Technical Analysis (TA) and Moving Average Convergence Divergence, MACD.
Once again, the website does not guarantee any results or investment return based on the information and instruction you have read here. It should be used as learning aids only and if you decide to trade real money, all trading decision should be your own.
We learn from many past and present great traders. Kudo to these master.
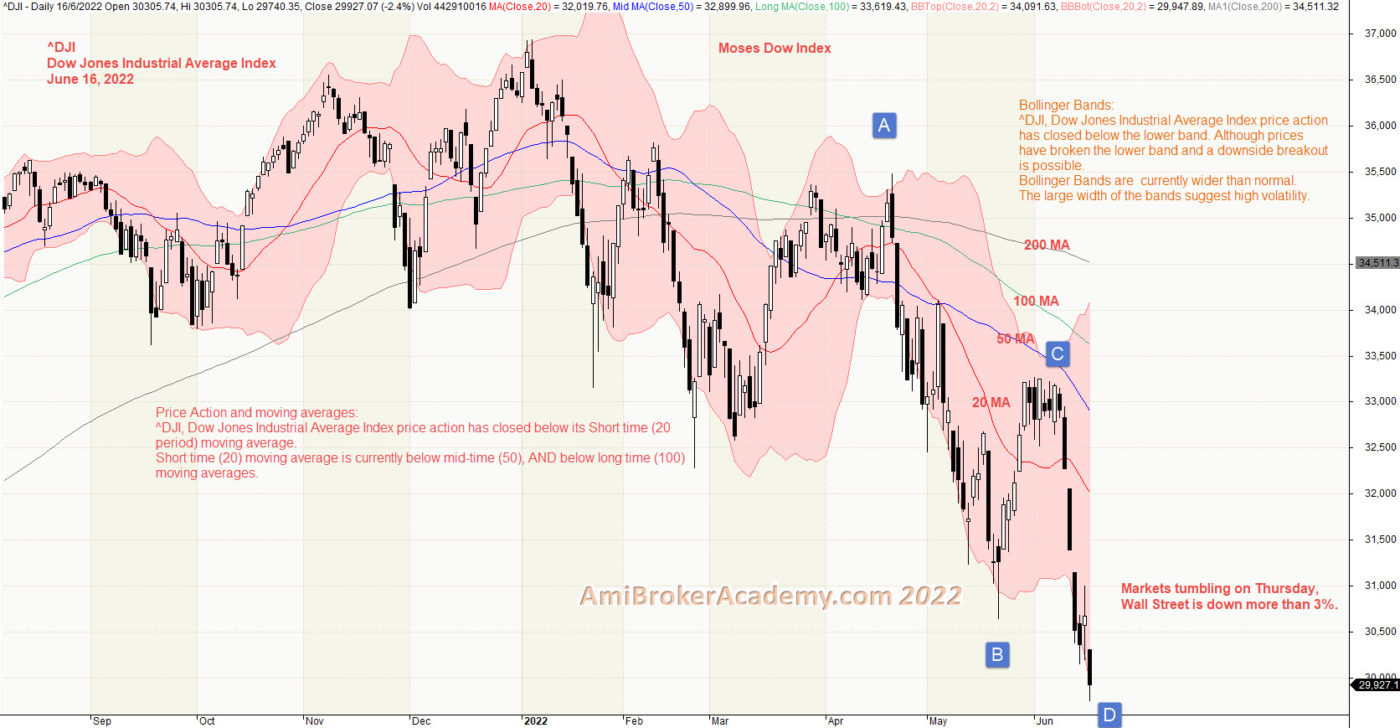
Price Action reflect the market emotions, it factor in news, buy or sell emotions.
Moving Average is a great visual aid. When the MA slops down, and price action close below the MA, the trend is likely bearish. The reverse is bullish. Bollinger bands is a great visual tool too, the price action encloses within the bands, when the band widen the price action is volatile, when the band narrow the price action is less volatile.
If you are a buy and hold strategist, Will you sell now or buy now? Remember only buy near support, and sell near resistance. Wait for the price action draw near either resistance or support before action.
Think Think got more Things
In trading, some predict the up or down on the trend. Here, we look for support, strong support to buy. Or take profit when price action test the resistance.
20220616 Dow Jones Industrial Average Index and Bollinger Bands
Moses Power Charting Moses Index
Official AmiBrokerAcademy.com Charting
Disclaimer
The above result is for illustration purpose. It is meant to be used for learning buy or sell signals. We do not recommend for any particular stocks. If particular stocks of such are mentioned, they are meant as a demonstration of Amibroker as a powerful charting software. Amibroker is a charting software, it can program to scan the stocks for buy and sell signals. Or backtest for any trading strategy or technique.
We post script generated signals. Not all scan results are shown here depending on selection criterial. The MACD signal should use with price action. Users must understand what MACD and price action are all about before using them. If necessary you should attend a course to learn more on Technical Analysis (TA) and Moving Average Convergence Divergence, MACD.
Once again, the website does not guarantee any results or investment return based on the information and instruction you have read here. It should be used as learning aids only and if you decide to trade real money, all trading decision should be your own.
We learn from many past and present great traders. Kudo to these master.
Welcome to AmiBroker Academy dot com, amibrokeracademy.com.
This was the analysis we did back in 2015. Have fun!
If There is Only One Chart This is It
Moses Power Stock Chart.
We Believe – Buy Support or Sell Resistance.
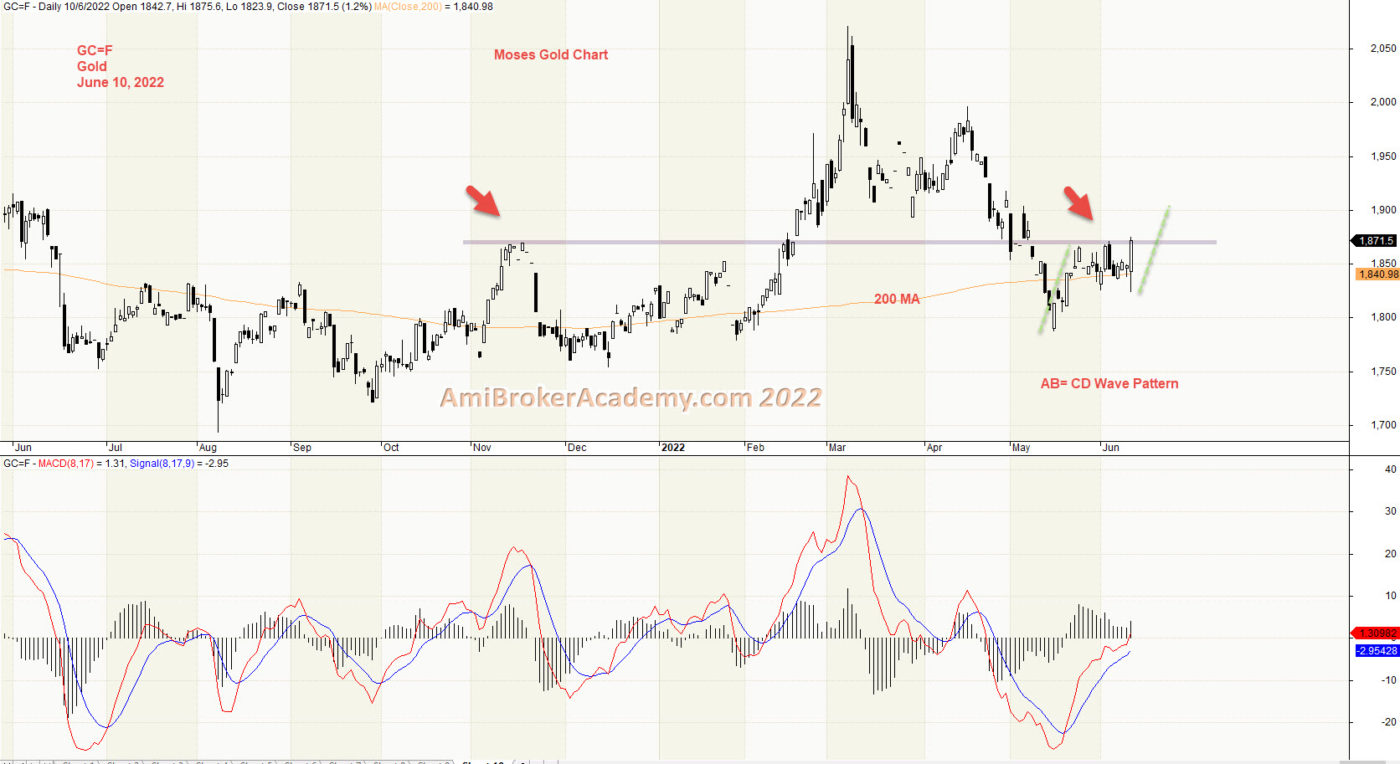
1) Gold and MACD
Price Action reflect the market emotions, it factor in news, buy or sell emotions.
Price Action is currently resisted by strong level. See Chart.
MACD is a great indicator. It signals a potential change in price action direction.
Price Action moves lower low, and MACD Signal or MACD-H forms higher low may signal a change in price action direction. But indicator is just like traffic light, you don’t stop at every traffic light. Therefore, trade with eyes open.
If you are a buy and hold strategist, Will you sell now or buy now? Remember only buy near support, and sell near resistance. Wait for the price action draw near either resistance or support before action.
Think Think got more Things
In trading, some predict the up or down on the trend. Here, we look for support, strong support to buy. Or take profit when price action test the resistance.
20220610 Gold and MACD
Moses Power Charting
Official AmiBrokerAcademy.com Charting
Disclaimer
The above result is for illustration purpose. It is meant to be used for learning buy or sell signals. We do not recommend for any particular stocks. If particular stocks of such are mentioned, they are meant as a demonstration of Amibroker as a powerful charting software. Amibroker is a charting software, it can program to scan the stocks for buy and sell signals. Or backtest for any trading strategy or technique.
We post script generated signals. Not all scan results are shown here depending on selection criterial. The MACD signal should use with price action. Users must understand what MACD and price action are all about before using them. If necessary you should attend a course to learn more on Technical Analysis (TA) and Moving Average Convergence Divergence, MACD.
Once again, the website does not guarantee any results or investment return based on the information and instruction you have read here. It should be used as learning aids only and if you decide to trade real money, all trading decision should be your own.
We learn from many past and present great traders. Kudo to these master.
Welcome to AmiBroker Academy dot com, amibrokeracademy.com.
This was the analysis we did back in 2015. Have fun!
If There is Only One Chart This is It
Moses Power Stock Chart.
We Believe – Buy Support or Sell Resistance.
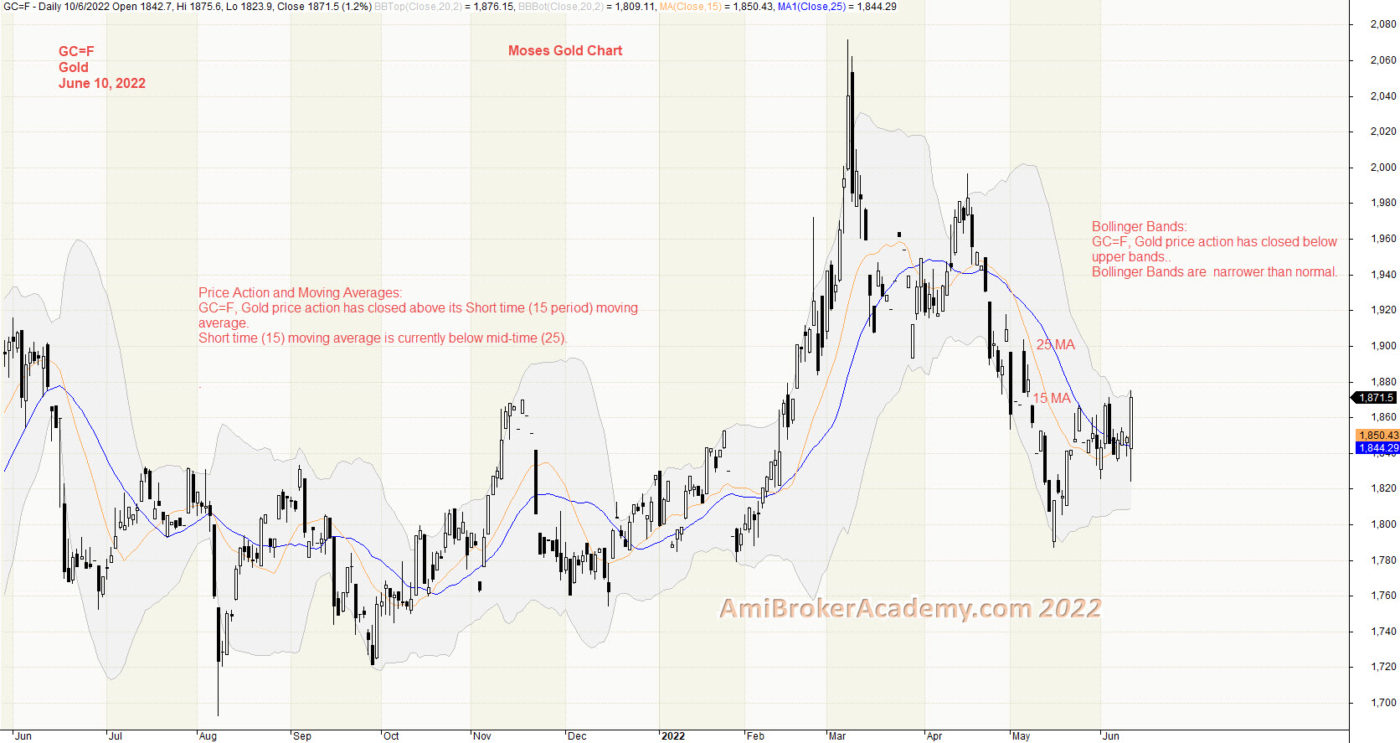
1) Gold and Bollinger Bands and Moving Averages
Price Action reflect the market emotions, it factor in news, buy or sell emotions.
Moving Average is a great visual aid. When the MA slops down, and price action close below the MA, the trend is likely bearish. The reverse is bullish. Bollinger bands is a great visual tool too, the price action encloses within the bands, when the band widen the price action is volatile, when the band narrow the price action is less volatile.
If you are a buy and hold strategist, Will you sell now or buy now? Remember only buy near support, and sell near resistance. Wait for the price action draw near either resistance or support before action.
Think Think got more Things
In trading, some predict the up or down on the trend. Here, we look for support, strong support to buy. Or take profit when price action test the resistance.
20220610 Gold and Bollinger Bands
Moses Power Charting
Official AmiBrokerAcademy.com Charting
Disclaimer
The above result is for illustration purpose. It is meant to be used for learning buy or sell signals. We do not recommend for any particular stocks. If particular stocks of such are mentioned, they are meant as a demonstration of Amibroker as a powerful charting software. Amibroker is a charting software, it can program to scan the stocks for buy and sell signals. Or backtest for any trading strategy or technique.
We post script generated signals. Not all scan results are shown here depending on selection criterial. The MACD signal should use with price action. Users must understand what MACD and price action are all about before using them. If necessary you should attend a course to learn more on Technical Analysis (TA) and Moving Average Convergence Divergence, MACD.
Once again, the website does not guarantee any results or investment return based on the information and instruction you have read here. It should be used as learning aids only and if you decide to trade real money, all trading decision should be your own.
We learn from many past and present great traders. Kudo to these master.
Welcome to AmiBroker Academy dot com, amibrokeracademy.com.
This was the analysis we did back in 2015. Have fun!
If There is Only One Chart This is It
Moses Power Stock Chart.
We Believe – Buy Support or Sell Resistance.
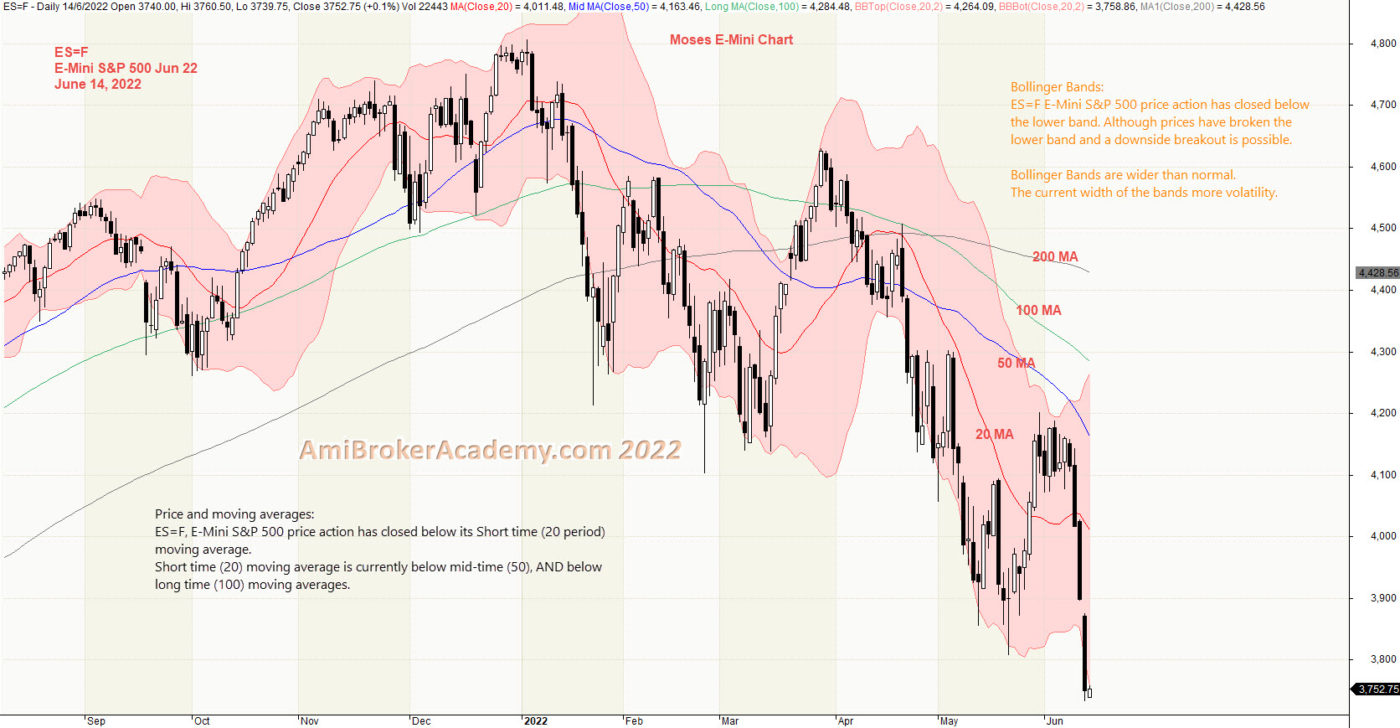
1) E-Mini S&P 500 and Bollinger Bands and Moving Averages
Price Action reflect the market emotions, it factor in news, buy or sell emotions.
Moving Average is a great visual aid. When the MA slops down, and price action close below the MA, the trend is likely bearish. The reverse is bullish. Bollinger bands is a great visual tool too, the price action encloses within the bands, when the band widen the price action is volatile, when the band narrow the price action is less volatile.
If you are a buy and hold strategist, Will you sell now or buy now? Remember only buy near support, and sell near resistance. Wait for the price action draw near either resistance or support before action.
Think Think got more Things
In trading, some predict the up or down on the trend. Here, we look for support, strong support to buy. Or take profit when price action test the resistance.
20220614 E-Mini S&P 500 and Bollinger Bands and Moving Averages
Moses Power Charting
Official AmiBrokerAcademy.com Charting
Disclaimer
The above result is for illustration purpose. It is meant to be used for learning buy or sell signals. We do not recommend for any particular stocks. If particular stocks of such are mentioned, they are meant as a demonstration of Amibroker as a powerful charting software. Amibroker is a charting software, it can program to scan the stocks for buy and sell signals. Or backtest for any trading strategy or technique.
We post script generated signals. Not all scan results are shown here depending on selection criterial. The MACD signal should use with price action. Users must understand what MACD and price action are all about before using them. If necessary you should attend a course to learn more on Technical Analysis (TA) and Moving Average Convergence Divergence, MACD.
Once again, the website does not guarantee any results or investment return based on the information and instruction you have read here. It should be used as learning aids only and if you decide to trade real money, all trading decision should be your own.
We learn from many past and present great traders. Kudo to these master.
Welcome to AmiBroker Academy dot com, amibrokeracademy.com.
This was the analysis we did back in 2015. Have fun!
If There is Only One Chart This is It
Moses Power Stock Chart.
We Believe – Buy Support or Sell Resistance.
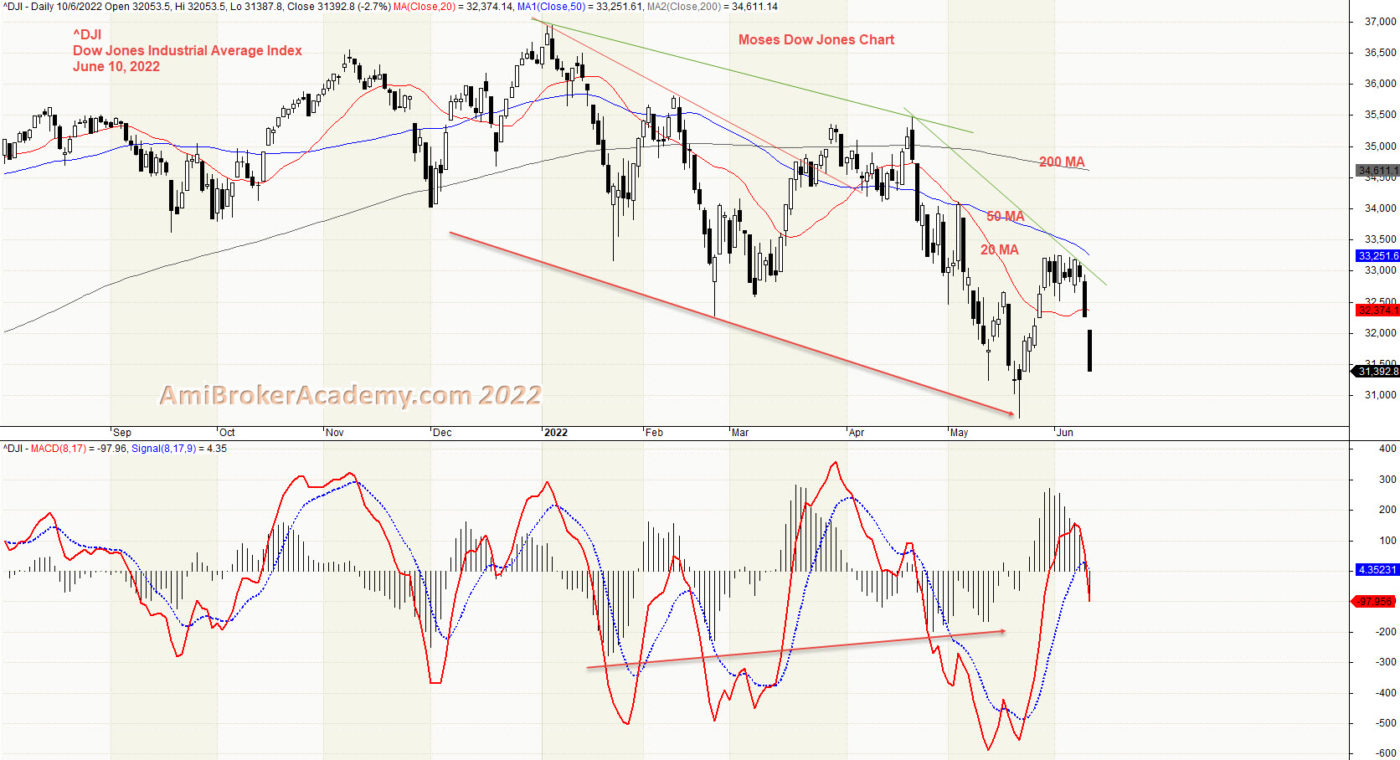
1) Dow Jones Industrial Average Index and MACD
Price Action reflect the market emotions, it factor in news, buy or sell emotions.
MACD is a great indicator. It signals a potential change in price action direction.
Price Action moves lower low, and MACD Signal or MACD-H forms higher low may signal a change in price action direction. But indicator is just like traffic light, you don’t stop at every traffic light. Therefore, trade with eyes open.
If you are a buy and hold strategist, Will you sell now or buy now? Remember only buy near support, and sell near resistance. Wait for the price action draw near either resistance or support before action.
Think Think got more Things
In trading, some predict the up or down on the trend. Here, we look for support, strong support to buy. Or take profit when price action test the resistance.
20220610 Dow Jones Industrial Average Index and MACD
Moses Power Charting
Official AmiBrokerAcademy.com Charting
Disclaimer
The above result is for illustration purpose. It is meant to be used for learning buy or sell signals. We do not recommend for any particular stocks. If particular stocks of such are mentioned, they are meant as a demonstration of Amibroker as a powerful charting software. Amibroker is a charting software, it can program to scan the stocks for buy and sell signals. Or backtest for any trading strategy or technique.
We post script generated signals. Not all scan results are shown here depending on selection criterial. The MACD signal should use with price action. Users must understand what MACD and price action are all about before using them. If necessary you should attend a course to learn more on Technical Analysis (TA) and Moving Average Convergence Divergence, MACD.
Once again, the website does not guarantee any results or investment return based on the information and instruction you have read here. It should be used as learning aids only and if you decide to trade real money, all trading decision should be your own.
We learn from many past and present great traders. Kudo to these master.
Welcome to AmiBroker Academy dot com, amibrokeracademy.com.
This was the analysis we did back in 2015. Have fun!
If There is Only One Chart This is It
Moses Power Stock Chart.
We Believe – Buy Support or Sell Resistance.
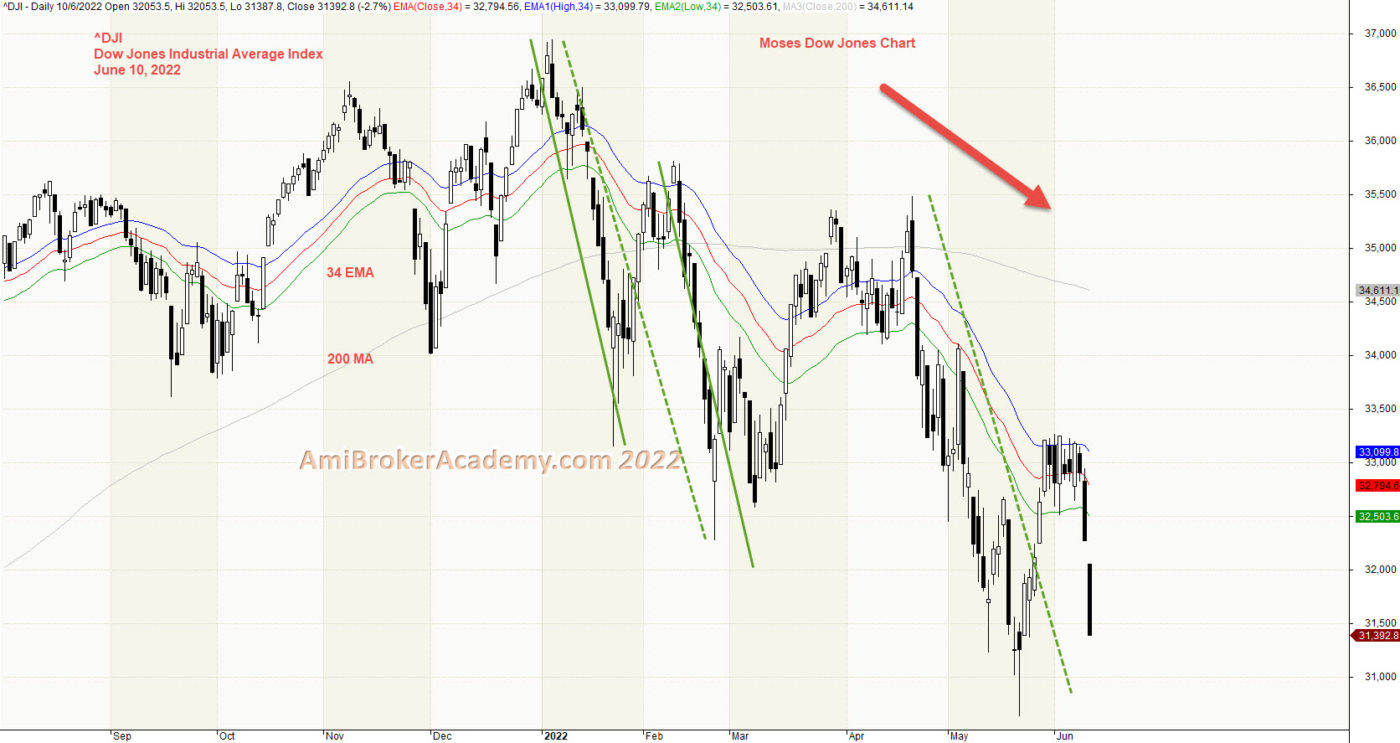
1) Dow Jones Industrial Average Index and River and ABCD
Price Action reflect the market emotions, it factor in news, buy or sell emotions.
MA, Moving Average is a great visual tool to identify trend. When MA slop up and price action above MA, bull bias. The opposite is bearish.
Raghee Horner has a famous wave pattern using moving average. Many years back she instead of using one MA, she uses three, the close, high and low MA. Three MAs form a wave band, or River. The band provides even a greater visual effect. See chart.
If you are a buy and hold strategist, Will you sell now or buy now? Remember only buy near support, and sell near resistance. Wait for the price action draw near either resistance or support before action.
Gartley ABCD wave patterns, you could also easily identify a few ABCD patterns on the River.
So River provides you the trend, and ABCD wave pattern provides you the possible direction. Have fun!
Think Think got more Things
In trading, some predict the up or down on the trend. Here, we look for support, strong support to buy. Or take profit when price action test the resistance.
20220610 Dow Jones Industrial Average Index and River and ABCD
Moses Power Charting
Official AmiBrokerAcademy.com Charting
Disclaimer
The above result is for illustration purpose. It is meant to be used for learning buy or sell signals. We do not recommend for any particular stocks. If particular stocks of such are mentioned, they are meant as a demonstration of Amibroker as a powerful charting software. Amibroker is a charting software, it can program to scan the stocks for buy and sell signals. Or backtest for any trading strategy or technique.
We post script generated signals. Not all scan results are shown here depending on selection criterial. The MACD signal should use with price action. Users must understand what MACD and price action are all about before using them. If necessary you should attend a course to learn more on Technical Analysis (TA) and Moving Average Convergence Divergence, MACD.
Once again, the website does not guarantee any results or investment return based on the information and instruction you have read here. It should be used as learning aids only and if you decide to trade real money, all trading decision should be your own.
We learn from many past and present great traders. Kudo to these master.
Welcome to AmiBroker Academy dot com, amibrokeracademy.com.
This was the analysis we did back in 2015. Have fun!
If There is Only One Chart This is It
Moses Power Stock Chart.
We Believe – Buy Support or Sell Resistance.
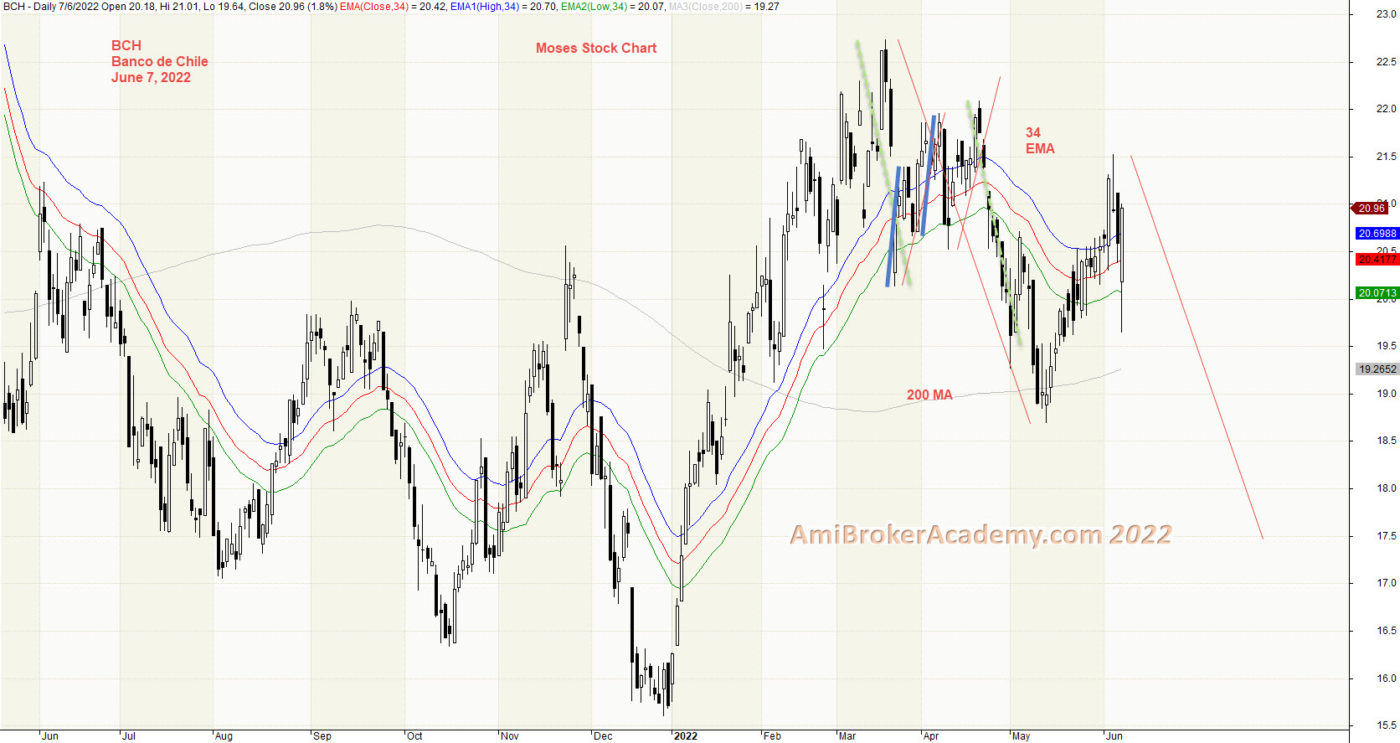
1) Banco de Chile and River and ABCD
Price Action reflect the market emotions, it factor in news, buy or sell emotions.
MA, Moving Average is a great visual tool to identify trend. When MA slop up and price action above MA, bull bias. The opposite is bearish.
Raghee many years back, instead of using one MA, she uses three, the close, high and low MA. Three MAs form a wave band, or River. River provides even a greater visual effect. See chart.
If you are a buy and hold strategist, Will you sell now or buy now? Remember only buy near support, and sell near resistance. Wait for the price action draw near either resistance or support before action.
Gartley ABCD wave patterns, you could also easily identify many ABCD patterns on the River.
So River provides you the trend, and ABCD wave pattern provides you the possible direction. Have fun!
Think Think got more Things
In trading, some predict the up or down on the trend. Here, we look for support, strong support to buy. Or take profit when price action test the resistance.
20220607 Banco de Chile and River and ABCD
Moses Power Charting
Official AmiBrokerAcademy.com Charting
Disclaimer
The above result is for illustration purpose. It is meant to be used for learning buy or sell signals. We do not recommend for any particular stocks. If particular stocks of such are mentioned, they are meant as a demonstration of Amibroker as a powerful charting software. Amibroker is a charting software, it can program to scan the stocks for buy and sell signals. Or backtest for any trading strategy or technique.
We post script generated signals. Not all scan results are shown here depending on selection criterial. The MACD signal should use with price action. Users must understand what MACD and price action are all about before using them. If necessary you should attend a course to learn more on Technical Analysis (TA) and Moving Average Convergence Divergence, MACD.
Once again, the website does not guarantee any results or investment return based on the information and instruction you have read here. It should be used as learning aids only and if you decide to trade real money, all trading decision should be your own.
We learn from many past and present great traders. Kudo to these master.
Welcome to AmiBroker Academy dot com, amibrokeracademy.com.
This was the analysis we did back in 2015. Have fun!
If There is Only One Chart This is It
Moses Power Stock Chart.
We Believe – Buy Support or Sell Resistance.
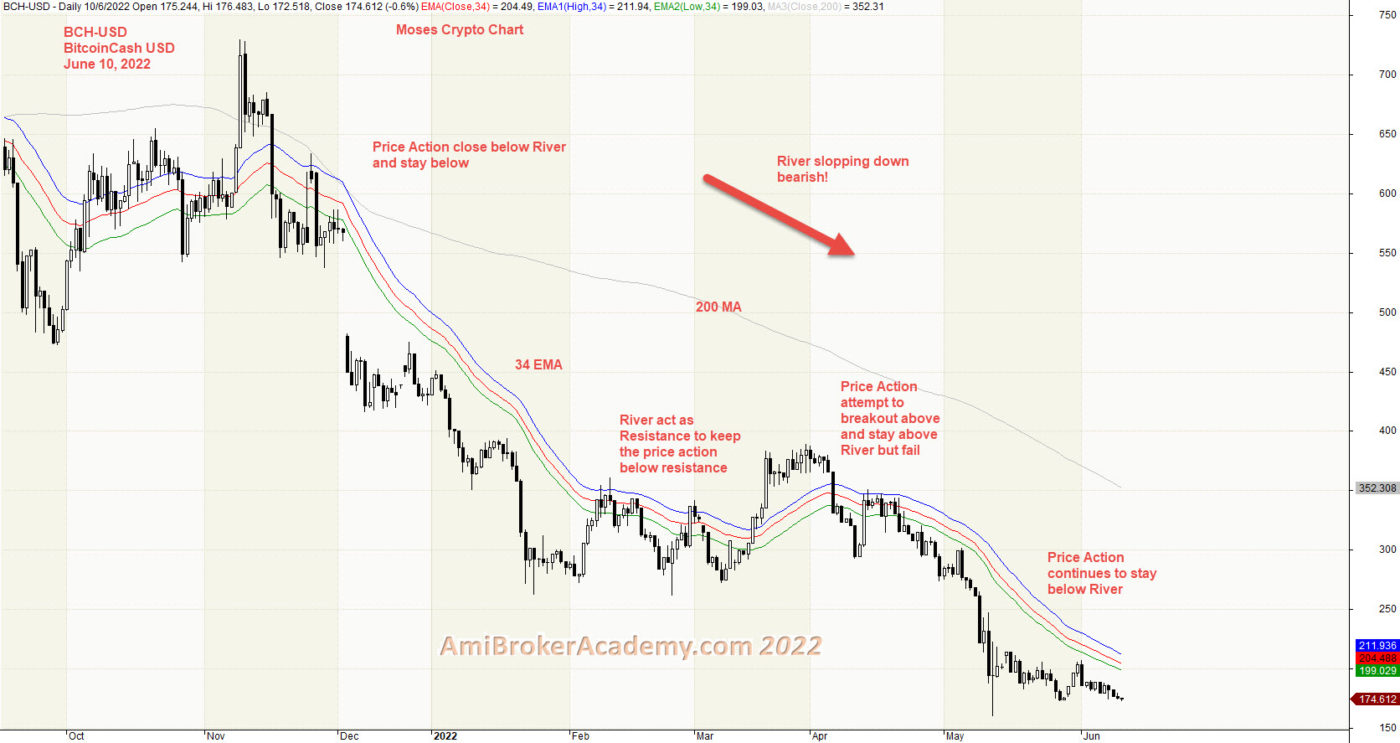
1) BitcoinCash USD and River
Price Action reflect the market emotions, it factor in news, buy or sell emotions.
MACD is a great indicator, especially MACD Divergence. When price moves higher and MACD or MACD-H forms lower high, it signals there is a potential of price action reversal. The reverse is true too.
You could easily spot a MACD divergence. The price action has response to the MACD divergence. However, be aware that the price action may not always response to the indicator. This is like traffic light, you don’t stop at all traffic light, right?
If you are a buy and hold strategist, Will you sell now or buy now? Remember only buy near support, and sell near resistance. Wait for the price action draw near either resistance or support before action.
Think Think got more Things
In trading, some predict the up or down on the trend. Here, we look for support, strong support to buy. Or take profit when price action test the resistance.
20220610 BitcoinCash USD and River
Moses Power Charting
Official AmiBrokerAcademy.com Charting
Disclaimer
The above result is for illustration purpose. It is meant to be used for learning buy or sell signals. We do not recommend for any particular stocks. If particular stocks of such are mentioned, they are meant as a demonstration of Amibroker as a powerful charting software. Amibroker is a charting software, it can program to scan the stocks for buy and sell signals. Or backtest for any trading strategy or technique.
We post script generated signals. Not all scan results are shown here depending on selection criterial. The MACD signal should use with price action. Users must understand what MACD and price action are all about before using them. If necessary you should attend a course to learn more on Technical Analysis (TA) and Moving Average Convergence Divergence, MACD.
Once again, the website does not guarantee any results or investment return based on the information and instruction you have read here. It should be used as learning aids only and if you decide to trade real money, all trading decision should be your own.
We learn from many past and present great traders. Kudo to these master.
Welcome to AmiBroker Academy dot com, amibrokeracademy.com.
This was the analysis we did back in 2015. Have fun!
If There is Only One Chart This is It
Moses Power Stock Chart.
We Believe – Buy Support or Sell Resistance.
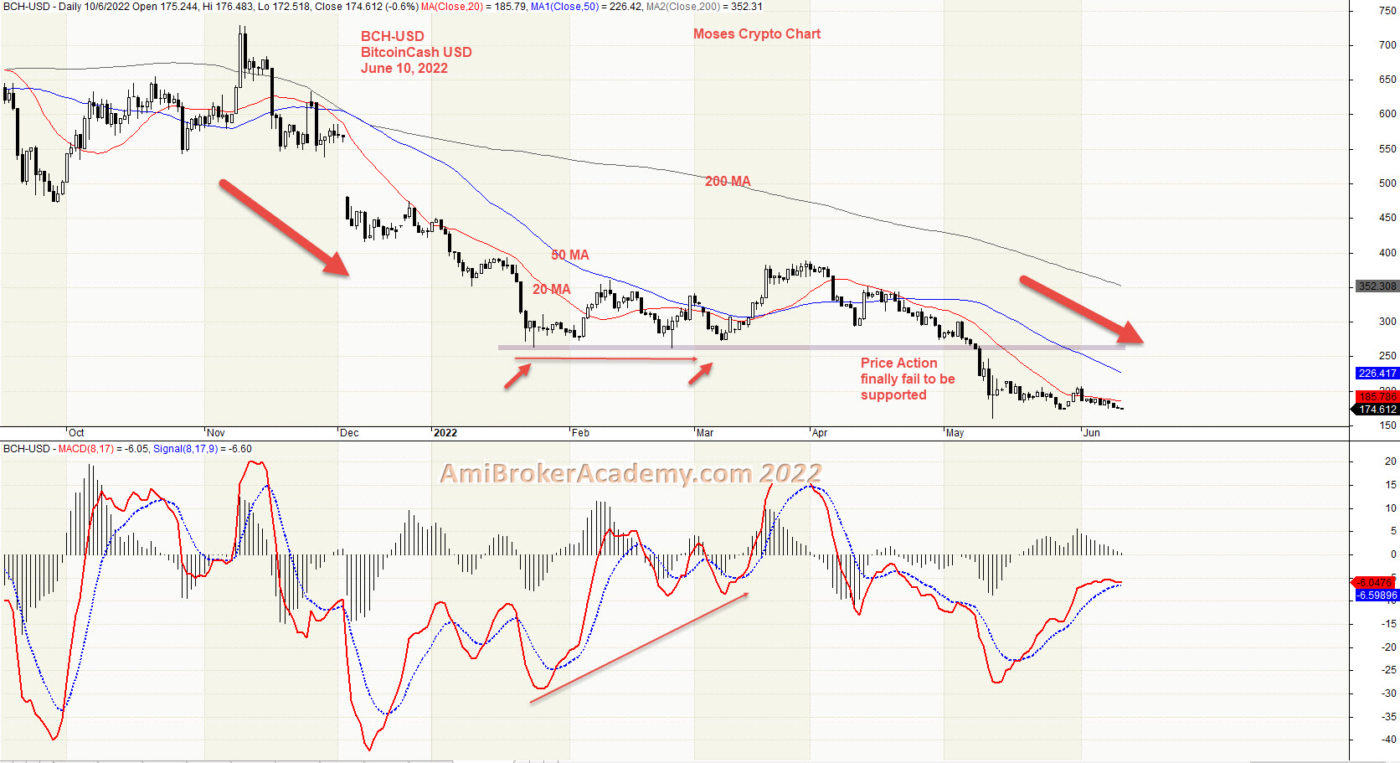
1) BitcoinCash USD and MACD
Price Action reflect the market emotions, it factor in news, buy or sell emotions.
MACD is a great indicator, especially MACD Divergence. When price moves higher and MACD or MACD-H forms lower high, it signals there is a potential of price action reversal. The reverse is true too.
You could easily spot a MACD divergence. The price action has response to the MACD divergence. However, be aware that the price action may not always response to the indicator. This is like traffic light, you don’t stop at all traffic light, right?
If you are a buy and hold strategist, Will you sell now or buy now? Remember only buy near support, and sell near resistance. Wait for the price action draw near either resistance or support before action.
Think Think got more Things
In trading, some predict the up or down on the trend. Here, we look for support, strong support to buy. Or take profit when price action test the resistance.
20220610 BitcoinCash USD and MACD
Moses Power Charting
Official AmiBrokerAcademy.com Charting
Disclaimer
The above result is for illustration purpose. It is meant to be used for learning buy or sell signals. We do not recommend for any particular stocks. If particular stocks of such are mentioned, they are meant as a demonstration of Amibroker as a powerful charting software. Amibroker is a charting software, it can program to scan the stocks for buy and sell signals. Or backtest for any trading strategy or technique.
We post script generated signals. Not all scan results are shown here depending on selection criterial. The MACD signal should use with price action. Users must understand what MACD and price action are all about before using them. If necessary you should attend a course to learn more on Technical Analysis (TA) and Moving Average Convergence Divergence, MACD.
Once again, the website does not guarantee any results or investment return based on the information and instruction you have read here. It should be used as learning aids only and if you decide to trade real money, all trading decision should be your own.
We learn from many past and present great traders. Kudo to these master.