Welcome to AmiBroker Academy dot com, amibrokeracademy.com.
If There is Only One Chart This is It
This is not a site that provides buy or sell signals directly. We read the stock chart bar by bar. If you understand what we read, you will get the buy or sell idea. Have fun!
Buy or Sell, you decide
Trading is very simple yet very difficult. Price is either up or down. But catch the right move is not easy. I believe many must have missed the falling knife. Now, many will be watching the topping. Can any catch the topping? Will see.
Up Down or Sideways
Trading is all probability. The price action is either up, down or sideways.
Trade what you see. Manage your risk.
Our Believe – Buy Support Sell Resistance.
1) Haw Par Corporation Limited and Week High Low
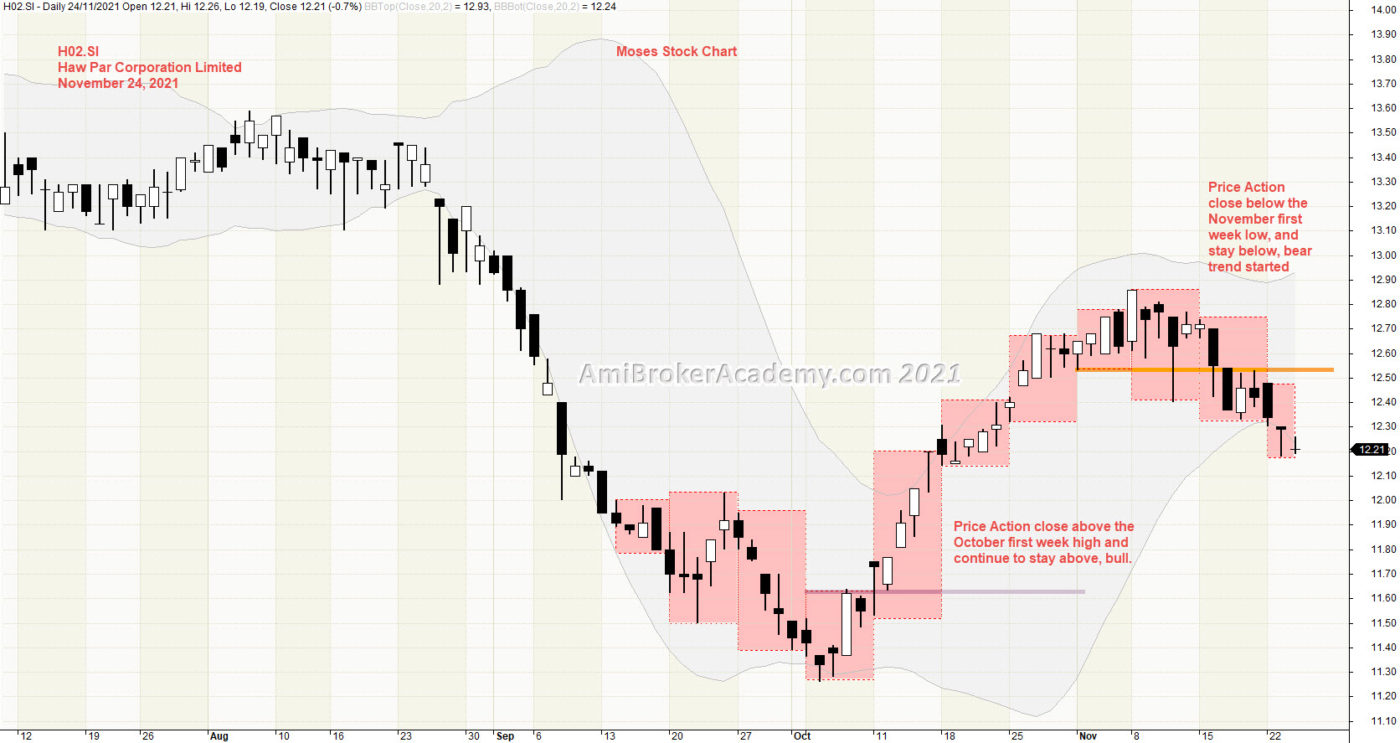
Picture worth a thousand words. Price Action is retrace back to the low of Bollinger Bands. Study the price action of the month week one to understand the trend.
Price Action close above week one of October and stay above. Price Action close below week one low and stay below. Trend has reverse.
See chart.
Can Price Action continues to go lower?
If you are a buy and hold strategist, Will you add now? Remember only buy near support, otherwise sell resistance. Wait for the price action near the support before buy.
20211124 Haw Par Corporation Limited and Week High Low
Moses Power Charting
Official AmiBrokerAcademy.com Charting
Disclaimer
The above result is for illustration purpose. It is meant to be used for learning buy or sell signals. We do not recommend for any particular stocks. If particular stocks of such are mentioned, they are meant as a demonstration of Amibroker as a powerful charting software. Amibroker is a charting software, it can program to scan the stocks for buy and sell signals. Or backtest for any trading strategy or technique.
We post script generated signals. Not all scan results are shown here depending on selection criterial. The MACD signal should use with price action. Users must understand what MACD and price action are all about before using them. If necessary you should attend a course to learn more on Technical Analysis (TA) and Moving Average Convergence Divergence, MACD.
Once again, the website does not guarantee any results or investment return based on the information and instruction you have read here. It should be used as learning aids only and if you decide to trade real money, all trading decision should be your own.
We learn from many past and present great traders. Kudo to these master.
Welcome to AmiBroker Academy dot com, amibrokeracademy.com.
If There is Only One Chart This is It
This is not a site that provides buy or sell signals directly. We read the stock chart bar by bar. If you understand what we read, you will get the buy or sell idea. Have fun!
Buy or Sell, you decide
Trading is very simple yet very difficult. Price is either up or down. But catch the right move is not easy. I believe many must have missed the falling knife. Now, many will be watching the topping. Can any catch the topping? Will see.
Up Down or Sideways
Trading is all probability. The price action is either up, down or sideways.
Trade what you see. Manage your risk.
Our Believe – Buy Support Sell Resistance.
1) MicroSoft Corporation and Week High Low
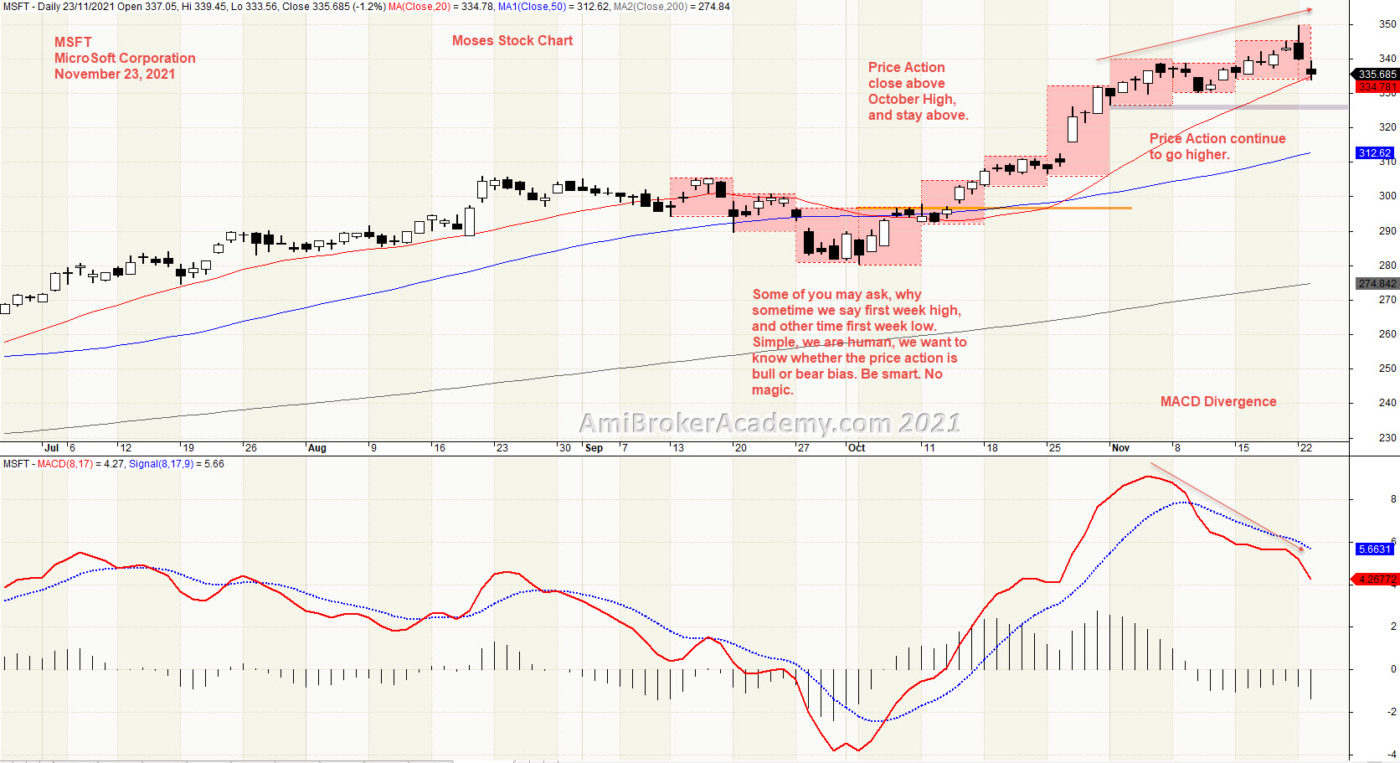
Picture worth a thousand words. 20 MA goes above 50 MA. Both 20 and 50 MA above 200 MA. Price action stay above 20 MA. Bull. What you think?
See chart.
Can Price Action continues to go higher?
If you are a buy and hold strategist, Will you continue to add now? Remember only buy near support, otherwise sell resistance.
20211123 MicroSoft Corporation and Week High Low
Moses Power Charting
Official AmiBrokerAcademy.com Charting
Disclaimer
The above result is for illustration purpose. It is meant to be used for learning buy or sell signals. We do not recommend for any particular stocks. If particular stocks of such are mentioned, they are meant as a demonstration of Amibroker as a powerful charting software. Amibroker is a charting software, it can program to scan the stocks for buy and sell signals. Or backtest for any trading strategy or technique.
We post script generated signals. Not all scan results are shown here depending on selection criterial. The MACD signal should use with price action. Users must understand what MACD and price action are all about before using them. If necessary you should attend a course to learn more on Technical Analysis (TA) and Moving Average Convergence Divergence, MACD.
Once again, the website does not guarantee any results or investment return based on the information and instruction you have read here. It should be used as learning aids only and if you decide to trade real money, all trading decision should be your own.
We learn from many past and present great traders. Kudo to these master.
Welcome to AmiBroker Academy dot com, amibrokeracademy.com.
If There is Only One Chart This is It
This is not a site that provides buy or sell signals directly. We read the stock chart bar by bar. If you understand what we read, you will get the buy or sell idea. Have fun!
Buy or Sell, you decide
Trading is very simple yet very difficult. Price is either up or down. But catch the right move is not easy. I believe many must have missed the falling knife. Now, many will be watching the topping. Can any catch the topping? Will see.
Up Down or Sideways
Trading is all probability. The price action is either up, down or sideways.
Trade what you see. Manage your risk.
Our Believe – Buy Support Sell Resistance.
1) The Aaron’s Company and Week High Low
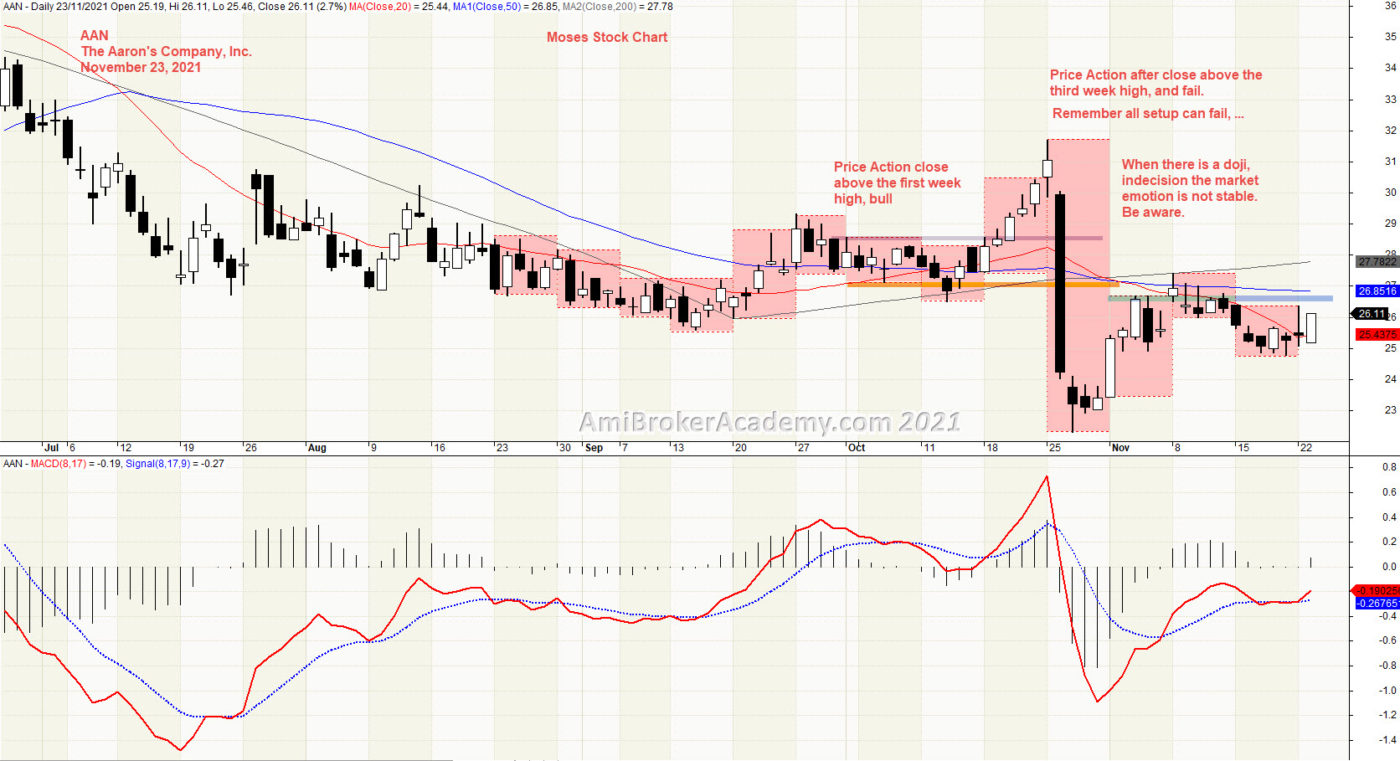
Picture worth a thousand words. 20 MA goes below 50 MA. Both 20 and 50 MA below 200 MA. Price action begin to close below 20 MA. So, bear trend? What you think? For sure, Price Action is currently below previous trend. Be more exact, the price action is below support.
See chart.
Can Price Action continues to go lower?
If you are a buy and hold strategist, Will you still add now? Remember only buy near support, otherwise sell resistance.
20211123 The Aaron’s Company and Week High Low
Moses Power Charting
Official AmiBrokerAcademy.com Charting
Disclaimer
The above result is for illustration purpose. It is meant to be used for learning buy or sell signals. We do not recommend for any particular stocks. If particular stocks of such are mentioned, they are meant as a demonstration of Amibroker as a powerful charting software. Amibroker is a charting software, it can program to scan the stocks for buy and sell signals. Or backtest for any trading strategy or technique.
We post script generated signals. Not all scan results are shown here depending on selection criterial. The MACD signal should use with price action. Users must understand what MACD and price action are all about before using them. If necessary you should attend a course to learn more on Technical Analysis (TA) and Moving Average Convergence Divergence, MACD.
Once again, the website does not guarantee any results or investment return based on the information and instruction you have read here. It should be used as learning aids only and if you decide to trade real money, all trading decision should be your own.
We learn from many past and present great traders. Kudo to these master.
Welcome to AmiBroker Academy dot com, amibrokeracademy.com.
If There is Only One Chart This is It
This is not a site that provides buy or sell signals directly. We read the stock chart bar by bar. If you understand what we read, you will get the buy or sell idea. Have fun!
Buy or Sell, you decide
Trading is very simple yet very difficult. Price is either up or down. But catch the right move is not easy. I believe many must have missed the falling knife. Now, many will be watching the topping. Can any catch the topping? Will see.
Up Down or Sideways
Trading is all probability. The price action is either up, down or sideways.
Trade what you see. Manage your risk.
Our Believe – Buy Support Sell Resistance.
1) Agilent Technologies and Week High Low
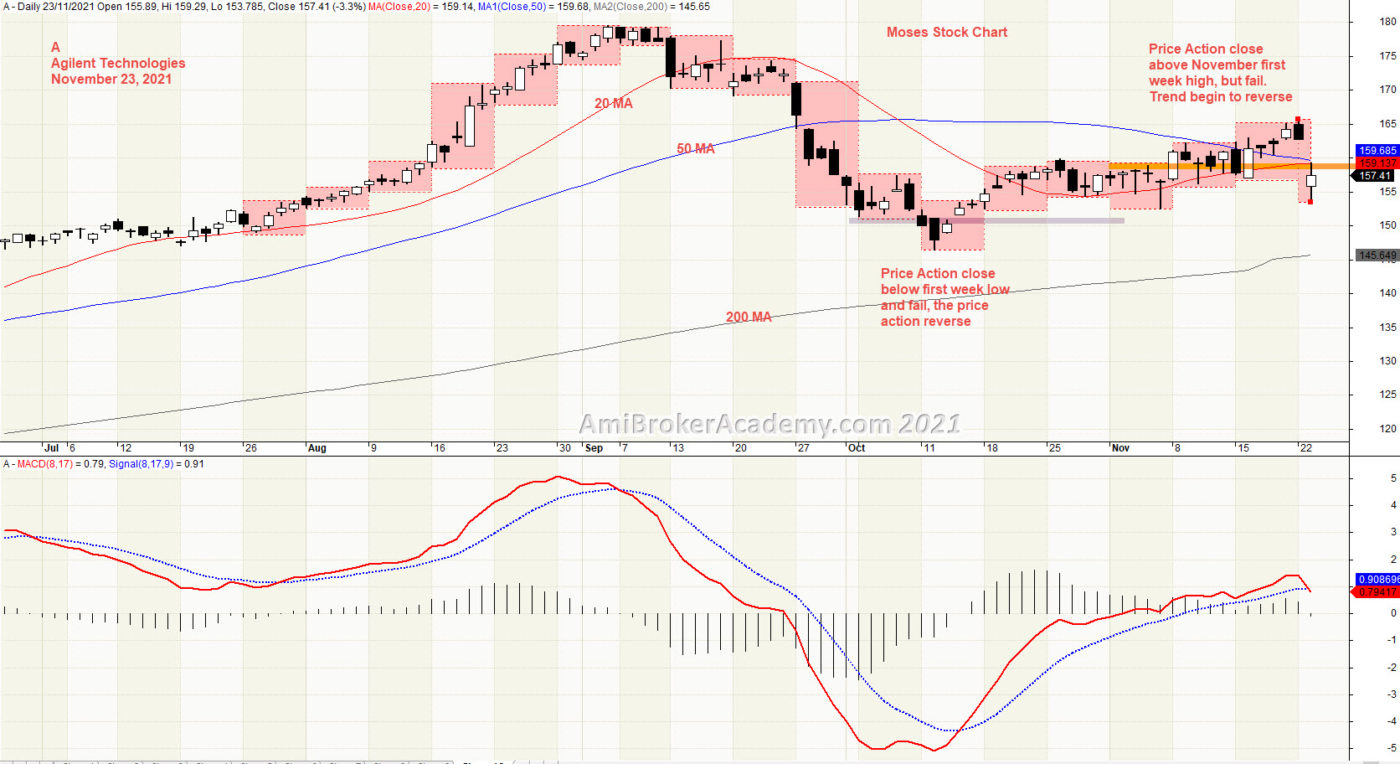
Picture worth a thousand words. 20 MA and 50 MA has become converge. Both 20 and 50 MA above 200 MA. But, price action begin to close below 20 MA. So, bear trend? What you think? Price Action has formed lower high.
See chart.
Can Price Action continues to go lower?
If you are a buy and hold strategist, Will you add now? Remember buy near support.
20211119 Agilent Technologies and Week High Low
Moses Power Charting
Official AmiBrokerAcademy.com Charting
Disclaimer
The above result is for illustration purpose. It is meant to be used for learning buy or sell signals. We do not recommend for any particular stocks. If particular stocks of such are mentioned, they are meant as a demonstration of Amibroker as a powerful charting software. Amibroker is a charting software, it can program to scan the stocks for buy and sell signals. Or backtest for any trading strategy or technique.
We post script generated signals. Not all scan results are shown here depending on selection criterial. The MACD signal should use with price action. Users must understand what MACD and price action are all about before using them. If necessary you should attend a course to learn more on Technical Analysis (TA) and Moving Average Convergence Divergence, MACD.
Once again, the website does not guarantee any results or investment return based on the information and instruction you have read here. It should be used as learning aids only and if you decide to trade real money, all trading decision should be your own.
We learn from many past and present great traders. Kudo to these master.
Welcome to AmiBroker Academy dot com, amibrokeracademy.com.
If There is Only One Chart This is It
This is not a site that provides buy or sell signals directly. We read the stock chart bar by bar. If you understand what we read, you will get the buy or sell idea. Have fun!
Buy or Sell, you decide
Trading is very simple yet very difficult. Price is either up or down. But catch the right move is not easy. I believe many must have missed the falling knife. Now, many will be watching the topping. Can any catch the topping? Will see.
Up Down or Sideways
Trading is all probability. The price action is either up, down or sideways.
Trade what you see. Manage your risk.
Our Believe – Buy Support Sell Resistance.
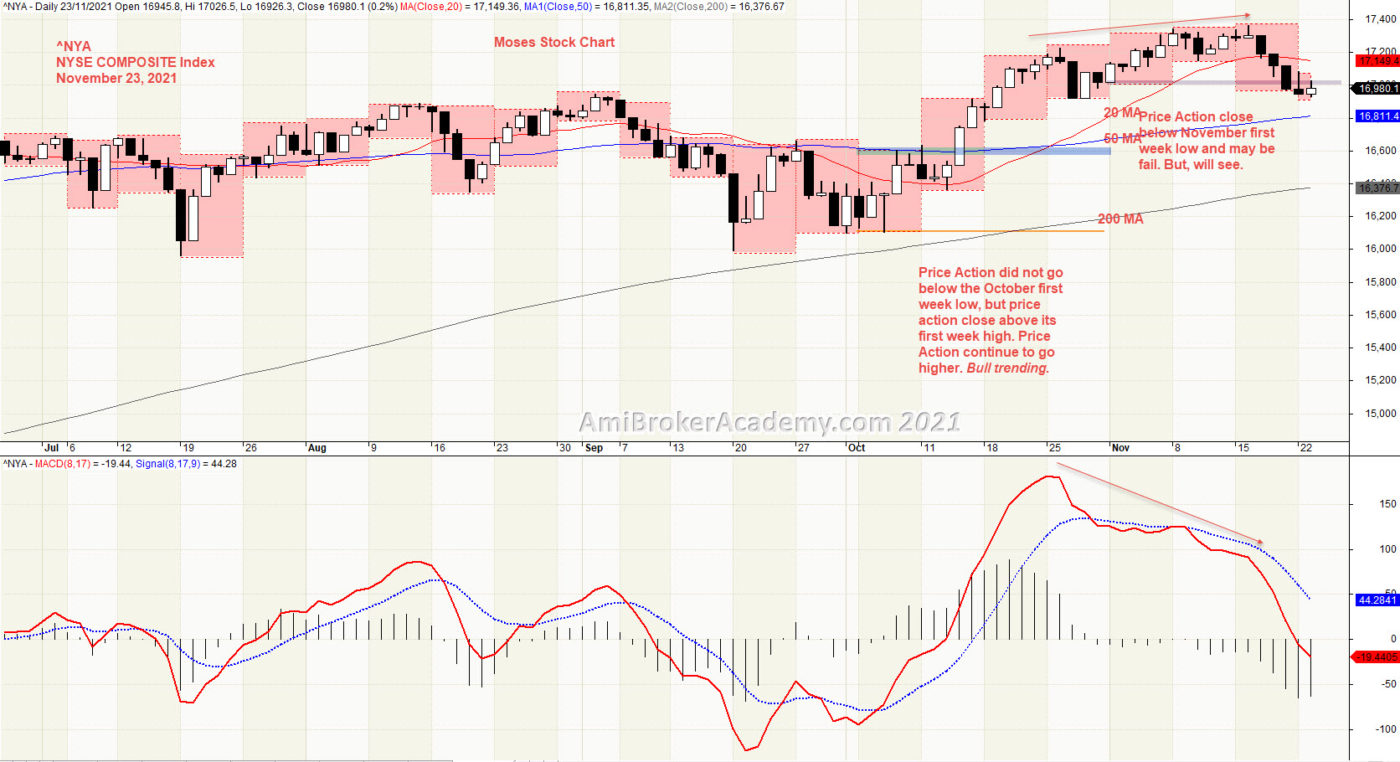
1) NYSE Composite Index and Week High Low and MACD
Picture worth a thousand words. 20 MA goes above 50 MA and both MA above 200 MA. But, price action close below 20 MA. So, bear trend? Stand back and look carefully. What you think? Price Action is now pullback, look left. You should spot the price action is now get supported by the previous high, resistance.
If you have follow the posts here, we have been provide you and understanding to identify bull or bear. Catch it? If not, go back and reread the posts until you have some idea.
See chart.
Can Price Action continues to go bull from October?
Study the MACD, and price action continue to go higher. But MACD forms low high. Price Action maybe pullback.
If you are a buy and hold strategist, Will you add now? Remember buy near support.
20211123 NYSE Composite Index and Week High Low and MACD
Moses Power Charting
Official AmiBrokerAcademy.com Charting
Disclaimer
The above result is for illustration purpose. It is meant to be used for learning buy or sell signals. We do not recommend for any particular stocks. If particular stocks of such are mentioned, they are meant as a demonstration of Amibroker as a powerful charting software. Amibroker is a charting software, it can program to scan the stocks for buy and sell signals. Or backtest for any trading strategy or technique.
We post script generated signals. Not all scan results are shown here depending on selection criterial. The MACD signal should use with price action. Users must understand what MACD and price action are all about before using them. If necessary you should attend a course to learn more on Technical Analysis (TA) and Moving Average Convergence Divergence, MACD.
Once again, the website does not guarantee any results or investment return based on the information and instruction you have read here. It should be used as learning aids only and if you decide to trade real money, all trading decision should be your own.
We learn from many past and present great traders. Kudo to these master.
Welcome to AmiBroker Academy dot com, amibrokeracademy.com.
If There is Only One Chart This is It
This is not a site that provides buy or sell signals directly. We read the stock chart bar by bar. If you understand what we read, you will get the buy or sell idea. Have fun!
Buy or Sell, you decide
Trading is very simple yet very difficult. Price is either up or down. But catch the right move is not easy. I believe many must have missed the falling knife. Now, many will be watching the topping. Can any catch the topping? Will see.
Up Down or Sideways
Trading is all probability. The price action is either up, down or sideways.
Trade what you see. Manage your risk.
Our Believe – Buy Support Sell Resistance.
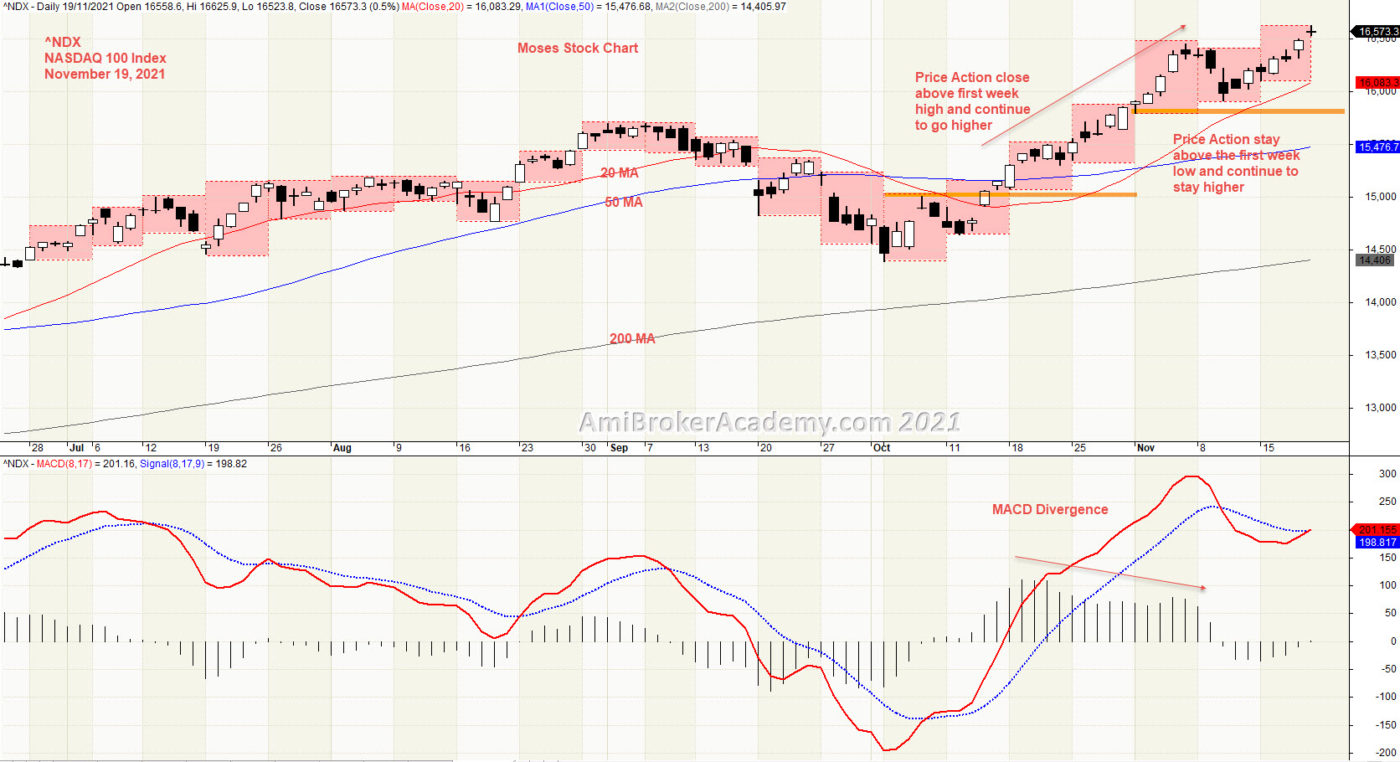
1) NASDAQ 100 Index and MACD and Week High Low
Picture worth a thousand words. 20 MA above 50 MA and both MA above 200 MA. From the chart, we see the price action went above the first week high of October and continue. On the next month, November, the price action continue above October high. Price action stay above. Price Action is more bull as compare to October.
See chart.
Can Price Action continues to go bull?
Study the MACD, and price action continue to go higher. But MACD-H forms low high. Price Action maybe pullback.
If you are a buy and hold strategist, Will you add now? Remember buy near support.
20211119 NASDAQ 100 Index and MACD and Week High Low
Moses Power Charting
Official AmiBrokerAcademy.com Charting
Disclaimer
The above result is for illustration purpose. It is meant to be used for learning buy or sell signals. We do not recommend for any particular stocks. If particular stocks of such are mentioned, they are meant as a demonstration of Amibroker as a powerful charting software. Amibroker is a charting software, it can program to scan the stocks for buy and sell signals. Or backtest for any trading strategy or technique.
We post script generated signals. Not all scan results are shown here depending on selection criterial. The MACD signal should use with price action. Users must understand what MACD and price action are all about before using them. If necessary you should attend a course to learn more on Technical Analysis (TA) and Moving Average Convergence Divergence, MACD.
Once again, the website does not guarantee any results or investment return based on the information and instruction you have read here. It should be used as learning aids only and if you decide to trade real money, all trading decision should be your own.
We learn from many past and present great traders. Kudo to these master.
Welcome to AmiBroker Academy dot com, amibrokeracademy.com.
If There is Only One Chart This is It
This is not a site that provides buy or sell signals directly. We read the stock chart bar by bar. If you understand what we read, you will get the buy or sell idea. Have fun!
Buy or Sell, you decide
Trading is very simple yet very difficult. Price is either up or down. But catch the right move is not easy. I believe many must have missed the falling knife. Now, many will be watching the topping. Can any catch the topping? Will see.
Up Down or Sideways
Trading is all probability. The price action is either up, down or sideways.
Trade what you see. Manage your risk.
Our Believe – Buy Support Sell Resistance.
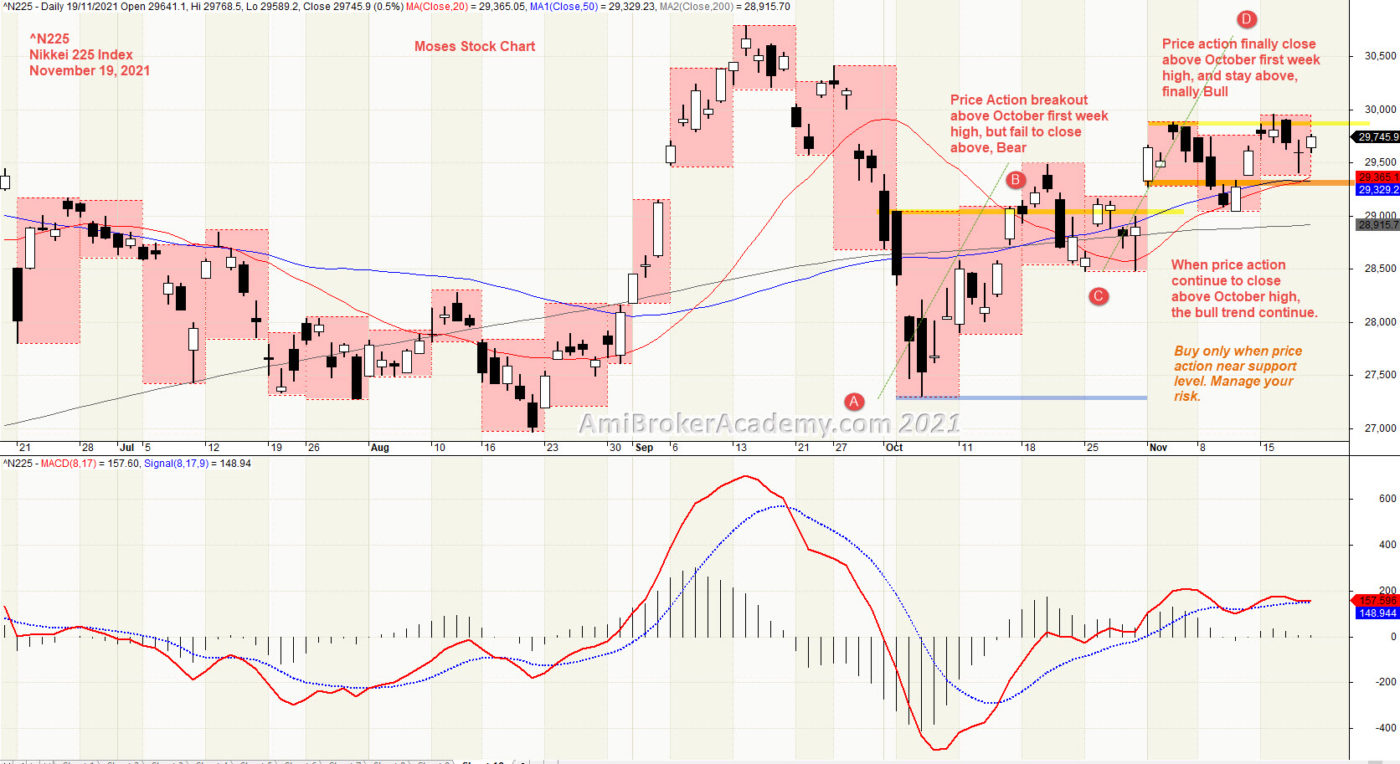
1) Nikkei 225 Index and week High Low
Picture worth a thousand words. 20 MA and 50 MA converge and above 200 MA. From the chart, we see the price action went above the first week high of October and fail, bull? No. On the next month, November, the price action breakout above October first week high. Price action stay above. Price Action is more bull as compare to October.
See chart.
Cam Price Action continues to go bull? From AB = CD pattern, price action is now on the CD wave. Chance is, the trend may continue to go higher.
If you are a buy and hold strategist, Will you add now? May not now, unless the price action is near support. Manage your risk.
Suggest, only buy near support. Wait for price action to retrace back and get support.
20211119 Nikkei 225 Index and week High Low
Moses Power Charting
Official AmiBrokerAcademy.com Charting
Disclaimer
The above result is for illustration purpose. It is meant to be used for learning buy or sell signals. We do not recommend for any particular stocks. If particular stocks of such are mentioned, they are meant as a demonstration of Amibroker as a powerful charting software. Amibroker is a charting software, it can program to scan the stocks for buy and sell signals. Or backtest for any trading strategy or technique.
We post script generated signals. Not all scan results are shown here depending on selection criterial. The MACD signal should use with price action. Users must understand what MACD and price action are all about before using them. If necessary you should attend a course to learn more on Technical Analysis (TA) and Moving Average Convergence Divergence, MACD.
Once again, the website does not guarantee any results or investment return based on the information and instruction you have read here. It should be used as learning aids only and if you decide to trade real money, all trading decision should be your own.
We learn from many past and present great traders. Kudo to these master.
Welcome to AmiBroker Academy dot com, amibrokeracademy.com.
If There is Only One Chart This is It
This is not a site that provides buy or sell signals directly. We read the stock chart bar by bar. If you understand what we read, you will get the buy or sell idea. Have fun!
Buy or Sell, you decide
Trading is very simple yet very difficult. Price is either up or down. But catch the right move is not easy. I believe many must have missed the falling knife. Now, many will be watching the topping. Can any catch the topping? Will see.
Up Down or Sideways
Trading is all probability. The price action is either up, down or sideways.
Trade what you see. Manage your risk.
Our Believe – Buy Support Sell Resistance.
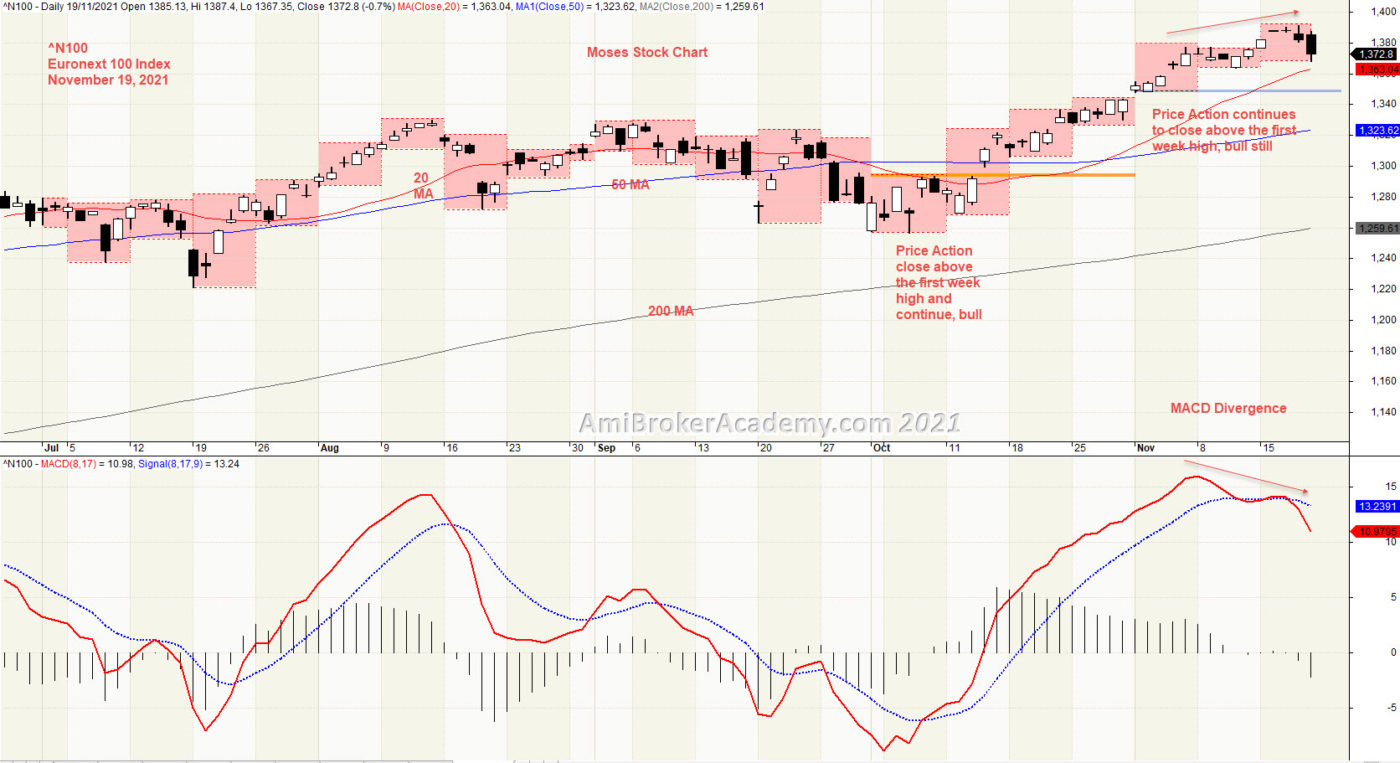
1) Euronext 100 Index and Week High Low
Picture worth a thousand words. 20 MA above 50 MA, both MA above longer time MA, 200 MA. From the chart, we see the price action went above the first week high of October and stay above, bull. And price action continue to stay above November first week low. Bull.
See chart.
Price Action continues to go bull.
If you are a buy and hold strategist, Will you add now? Obvious not now, wait for price action to pullbacknear support. Manage your risk.
Suggest, only buy near support. Wait for price action to retrace back and get support.
20211119 Nuronext 100 Index and Week High Low
Moses Power Charting
Official AmiBrokerAcademy.com Charting
Disclaimer
The above result is for illustration purpose. It is meant to be used for learning buy or sell signals. We do not recommend for any particular stocks. If particular stocks of such are mentioned, they are meant as a demonstration of Amibroker as a powerful charting software. Amibroker is a charting software, it can program to scan the stocks for buy and sell signals. Or backtest for any trading strategy or technique.
We post script generated signals. Not all scan results are shown here depending on selection criterial. The MACD signal should use with price action. Users must understand what MACD and price action are all about before using them. If necessary you should attend a course to learn more on Technical Analysis (TA) and Moving Average Convergence Divergence, MACD.
Once again, the website does not guarantee any results or investment return based on the information and instruction you have read here. It should be used as learning aids only and if you decide to trade real money, all trading decision should be your own.
We learn from many past and present great traders. Kudo to these master.
Welcome to AmiBroker Academy dot com, amibrokeracademy.com.
If There is Only One Chart This is It
This is not a site that provides buy or sell signals directly. We read the stock chart bar by bar. If you understand what we read, you will get the buy or sell idea. Have fun!
Buy or Sell, you decide
Trading is very simple yet very difficult. Price is either up or down. But catch the right move is not easy. I believe many must have missed the falling knife. Now, many will be watching the topping. Can any catch the topping? Will see.
Up Down or Sideways
Trading is all probability. The price action is either up, down or sideways.
Trade what you see. Manage your risk.
Our Believe – Buy Support Sell Resistance.
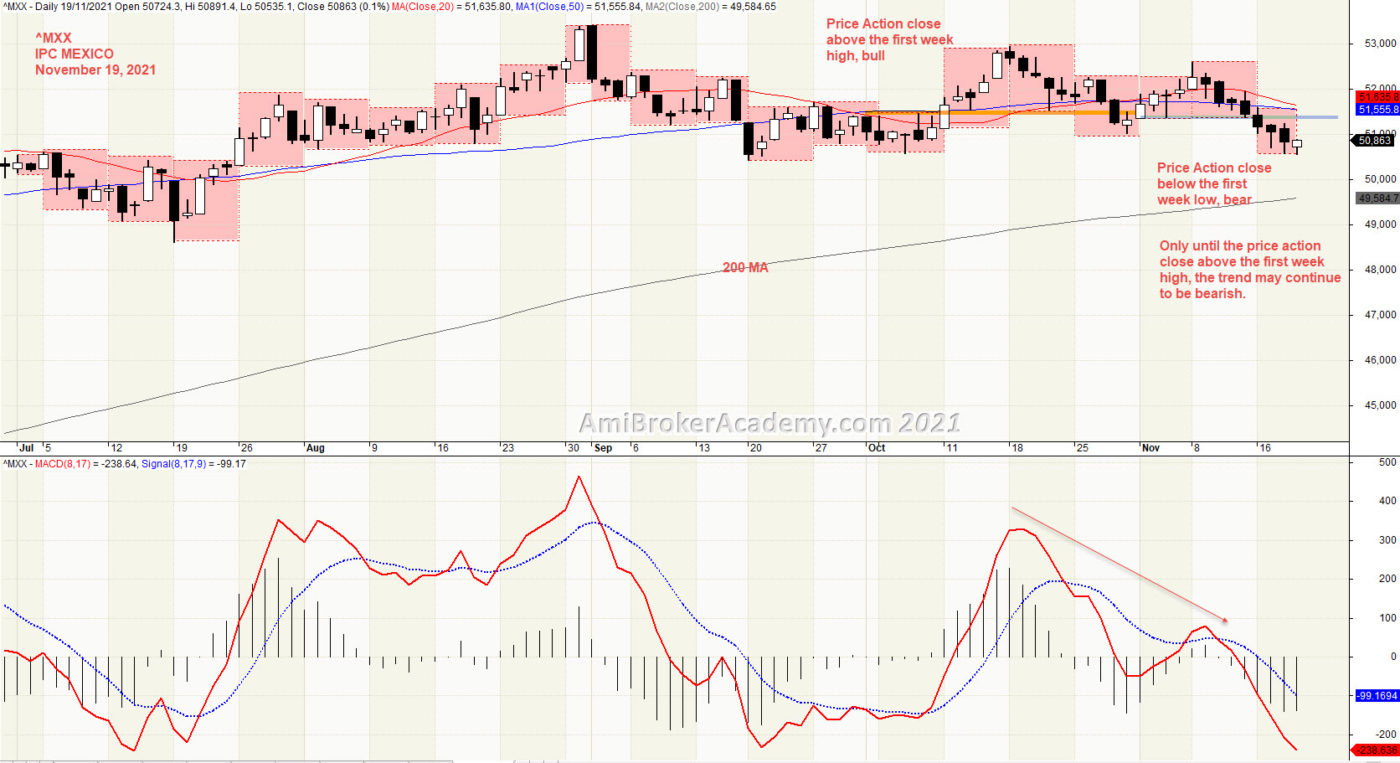
1) IPC MEXICO Index week high low and MACD
Picture worth a thousand words. 20 and 50 MA converge, both MA above longer time MA, 200 MA. From the chart, we see the price action went above the week one high of October and stay above, bull. And price action begin to stay below the low of November first week low. Bear.
See chart.
Price Action will stay bear till it goes above the low of week one.
If you are a buy and hold strategist, Will you add now? Obvious not now, wait for price action near support. Manage your risk.
Suggest, only buy near support. Wait for price action to retrace up.
20211119 IPC MEXICO Index week high low and MACD
Moses Power Charting
Official AmiBrokerAcademy.com Charting
Disclaimer
The above result is for illustration purpose. It is meant to be used for learning buy or sell signals. We do not recommend for any particular stocks. If particular stocks of such are mentioned, they are meant as a demonstration of Amibroker as a powerful charting software. Amibroker is a charting software, it can program to scan the stocks for buy and sell signals. Or backtest for any trading strategy or technique.
We post script generated signals. Not all scan results are shown here depending on selection criterial. The MACD signal should use with price action. Users must understand what MACD and price action are all about before using them. If necessary you should attend a course to learn more on Technical Analysis (TA) and Moving Average Convergence Divergence, MACD.
Once again, the website does not guarantee any results or investment return based on the information and instruction you have read here. It should be used as learning aids only and if you decide to trade real money, all trading decision should be your own.
We learn from many past and present great traders. Kudo to these master.
Welcome to AmiBroker Academy dot com, amibrokeracademy.com.
If There is Only One Chart This is It
This is not a site that provides buy or sell signals directly. We read the stock chart bar by bar. If you understand what we read, you will get the buy or sell idea. Have fun!
Buy or Sell, you decide
Trading is very simple yet very difficult. Price is either up or down. But catch the right move is not easy. I believe many must have missed the falling knife. Now, many will be watching the topping. Can any catch the topping? Will see.
Up Down or Sideways
Trading is all probability. The price action is either up, down or sideways.
Trade what you see. Manage your risk.
Our Believe – Buy Support Sell Resistance.
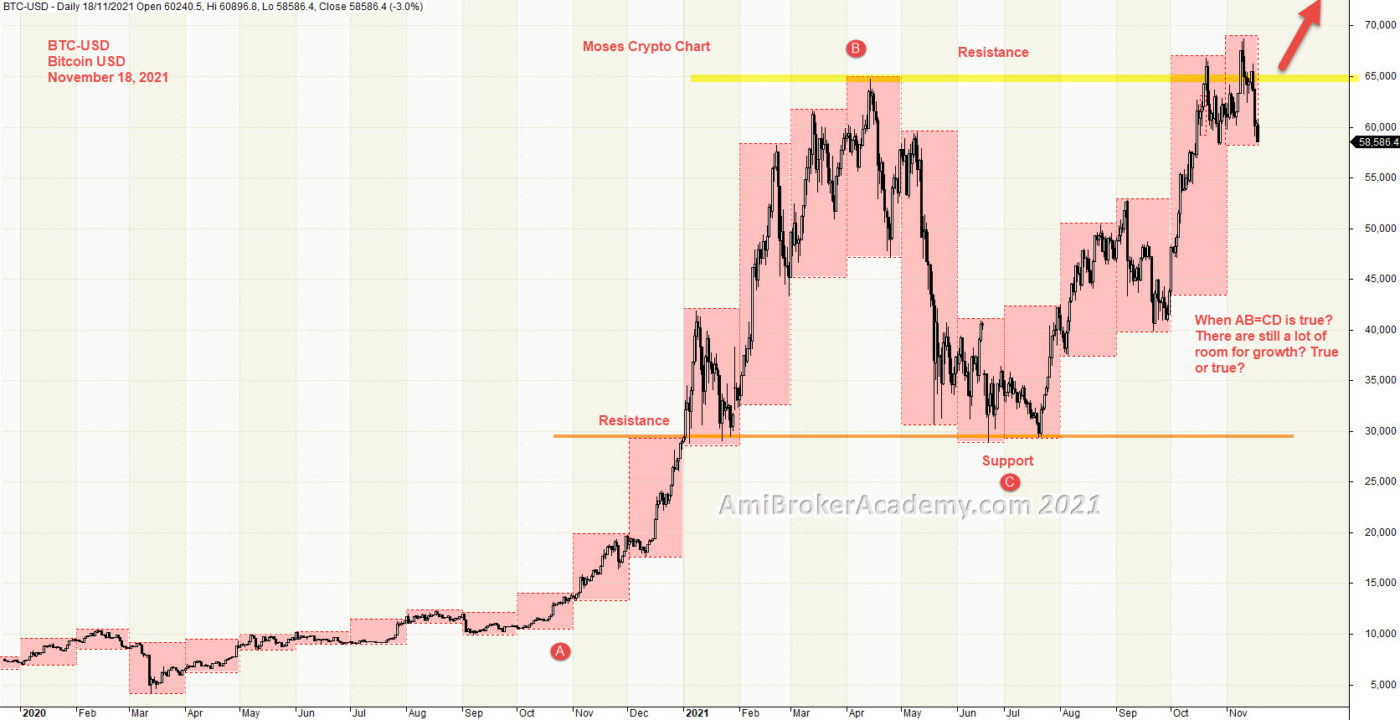
1) BTC Bitcoin and Month High Low
Picture worth a thousand words. Price Action retest the high. Price Action may move higher.
See chart.
Price Action get resisted by high. remember not to buy high and sell higher. Risk.
If you are a buy and hold strategist, Will you add now? Obvious not now, wait for price action near support. Manage your risk.
Once again suggest, buy near support. Wait for price action to pullback.
20211118 Bitcoin and Month High Low from 2020
Moses Power Charting
Official AmiBrokerAcademy.com Charting
Disclaimer
The above result is for illustration purpose. It is meant to be used for learning buy or sell signals. We do not recommend for any particular stocks. If particular stocks of such are mentioned, they are meant as a demonstration of Amibroker as a powerful charting software. Amibroker is a charting software, it can program to scan the stocks for buy and sell signals. Or backtest for any trading strategy or technique.
We post script generated signals. Not all scan results are shown here depending on selection criterial. The MACD signal should use with price action. Users must understand what MACD and price action are all about before using them. If necessary you should attend a course to learn more on Technical Analysis (TA) and Moving Average Convergence Divergence, MACD.
Once again, the website does not guarantee any results or investment return based on the information and instruction you have read here. It should be used as learning aids only and if you decide to trade real money, all trading decision should be your own.
We learn from many past and present great traders. Kudo to these master.
Welcome to AmiBroker Academy dot com, amibrokeracademy.com.
If There is Only One Chart This is It
This is not a site that provides buy or sell signals directly. We read the stock chart bar by bar. If you understand what we read, you will get the buy or sell idea. Have fun!
Buy or Sell, you decide
Trading is very simple yet very difficult. Price is either up or down. But catch the right move is not easy. I believe many must have missed the falling knife. Now, many will be watching the topping. Can any catch the topping? Will see.
Up Down or Sideways
Trading is all probability. The price action is either up, down or sideways.
Trade what you see. Manage your risk.
Our Believe – Buy Support Sell Resistance.
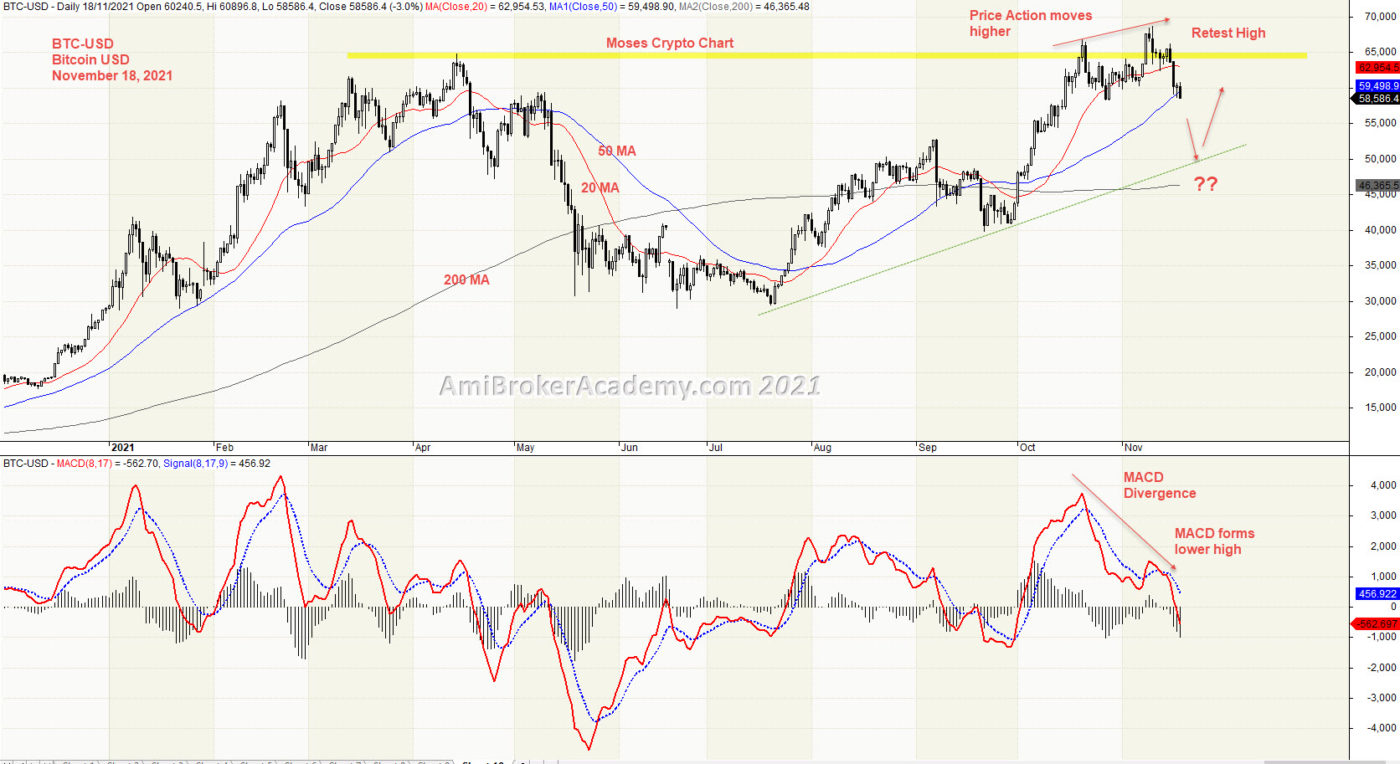
1) BTC Bitcoin and MACD Divergence
Picture worth a thousand words. Price Action close below 20 MA and get supported by 50 MA. Both 20, and 50 MA are above 200 MA. Bull bias. Price Action may continue to pullback and get supported by 200 MA.
See chart.
Moving Average is a very good visual tool to understand trend. Can you spot the trend? Besides that we see a price action continues to go higher but MACD forms lower high. Price Action may continues to pullback.
If you are a buy and hold strategist, Will you now add? Manage your risk.
Suggestion, buy near support. Wait for price action to pullback to a support before buy again.
20211118 Bitcoin and MACD MACD Divergence
Moses Power Charting
Official AmiBrokerAcademy.com Charting
Disclaimer
The above result is for illustration purpose. It is meant to be used for learning buy or sell signals. We do not recommend for any particular stocks. If particular stocks of such are mentioned, they are meant as a demonstration of Amibroker as a powerful charting software. Amibroker is a charting software, it can program to scan the stocks for buy and sell signals. Or backtest for any trading strategy or technique.
We post script generated signals. Not all scan results are shown here depending on selection criterial. The MACD signal should use with price action. Users must understand what MACD and price action are all about before using them. If necessary you should attend a course to learn more on Technical Analysis (TA) and Moving Average Convergence Divergence, MACD.
Once again, the website does not guarantee any results or investment return based on the information and instruction you have read here. It should be used as learning aids only and if you decide to trade real money, all trading decision should be your own.
We learn from many past and present great traders. Kudo to these master.
Welcome to AmiBroker Academy dot com, amibrokeracademy.com.
If There is Only One Chart This is It
This is not a site that provides buy or sell signals directly. We read the stock chart bar by bar. If you understand what we read, you will get the buy or sell idea. Have fun!
Buy or Sell, you decide
Trading is very simple yet very difficult. Price is either up or down. But catch the right move is not easy. I believe many must have missed the falling knife. Now, many will be watching the topping. Can any catch the topping? Will see.
Up Down or Sideways
Trading is all probability. The price action is either up, down or sideways.
Trade what you see. Manage your risk.
Our Believe – Buy Support Sell Resistance.
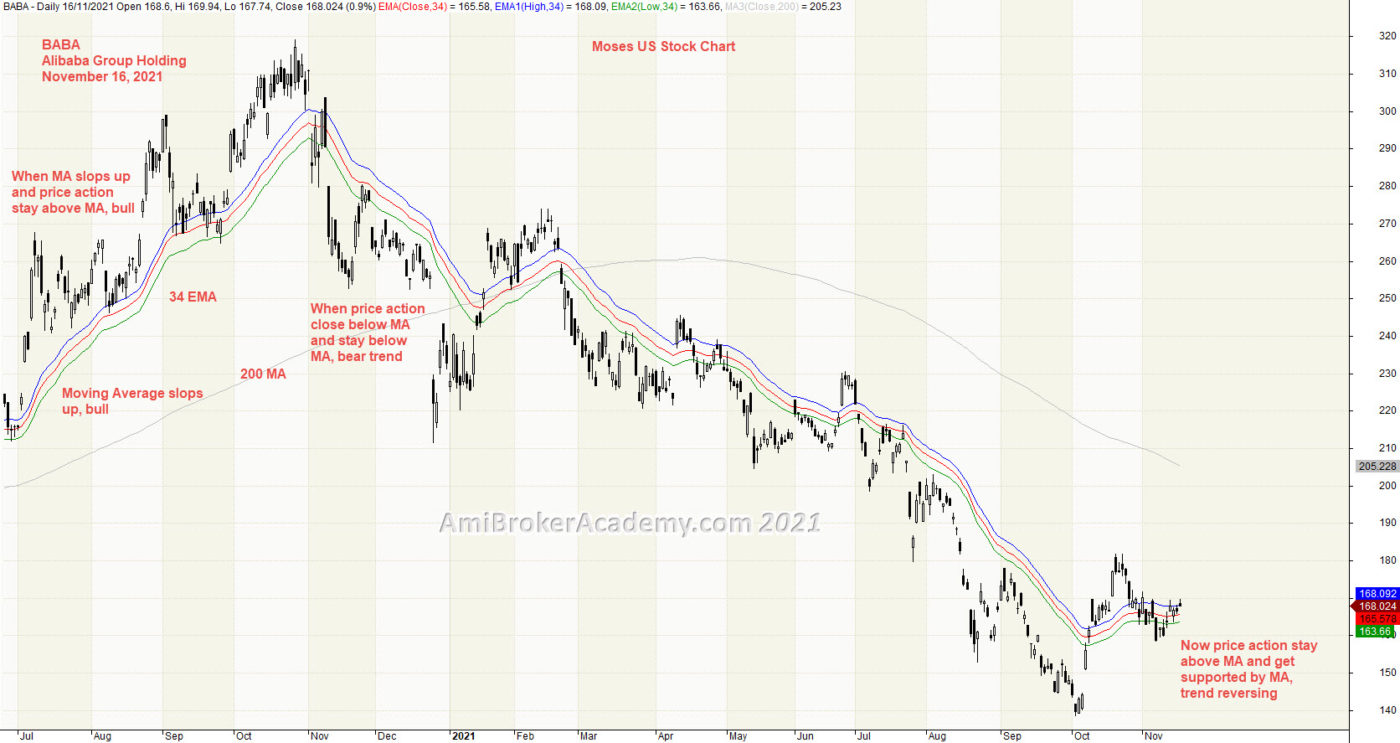
1) Alibaba Group Holding and River
Picture worth a thousand words. Price Action close below River, moving averages. Trend reverse. Price Action stay below river and continue below, bear trend, and trend follow.
See chart.
Moving Average is a very good visual tool to understand trend. Can you spot the trend reversing? From bull to bear, and from bear to turn bull.
If you are a buy and hold strategist, Will you now add? Manage your risk.
Suggestion, buy near support.
20211116 Alibaba Group Holding and River
Moses Power Charting
Official AmiBrokerAcademy.com Charting
Disclaimer
The above result is for illustration purpose. It is meant to be used for learning buy or sell signals. We do not recommend for any particular stocks. If particular stocks of such are mentioned, they are meant as a demonstration of Amibroker as a powerful charting software. Amibroker is a charting software, it can program to scan the stocks for buy and sell signals. Or backtest for any trading strategy or technique.
We post script generated signals. Not all scan results are shown here depending on selection criterial. The MACD signal should use with price action. Users must understand what MACD and price action are all about before using them. If necessary you should attend a course to learn more on Technical Analysis (TA) and Moving Average Convergence Divergence, MACD.
Once again, the website does not guarantee any results or investment return based on the information and instruction you have read here. It should be used as learning aids only and if you decide to trade real money, all trading decision should be your own.
We learn from many past and present great traders. Kudo to these master.
Welcome to AmiBroker Academy dot com, amibrokeracademy.com.
If There is Only One Chart This is It
This is not a site that provides buy or sell signals directly. We read the stock chart bar by bar. If you understand what we read, you will get the buy or sell idea. Have fun!
Buy or Sell, you decide
Trading is very simple yet very difficult. Price is either up or down. But catch the right move is not easy. I believe many must have missed the falling knife. Now, many will be watching the topping. Can any catch the topping? Will see.
Up Down or Sideways
Trading is all probability. The price action is either up, down or sideways.
Trade what you see. Manage your risk.
Our Believe – Buy Support Sell Resistance.
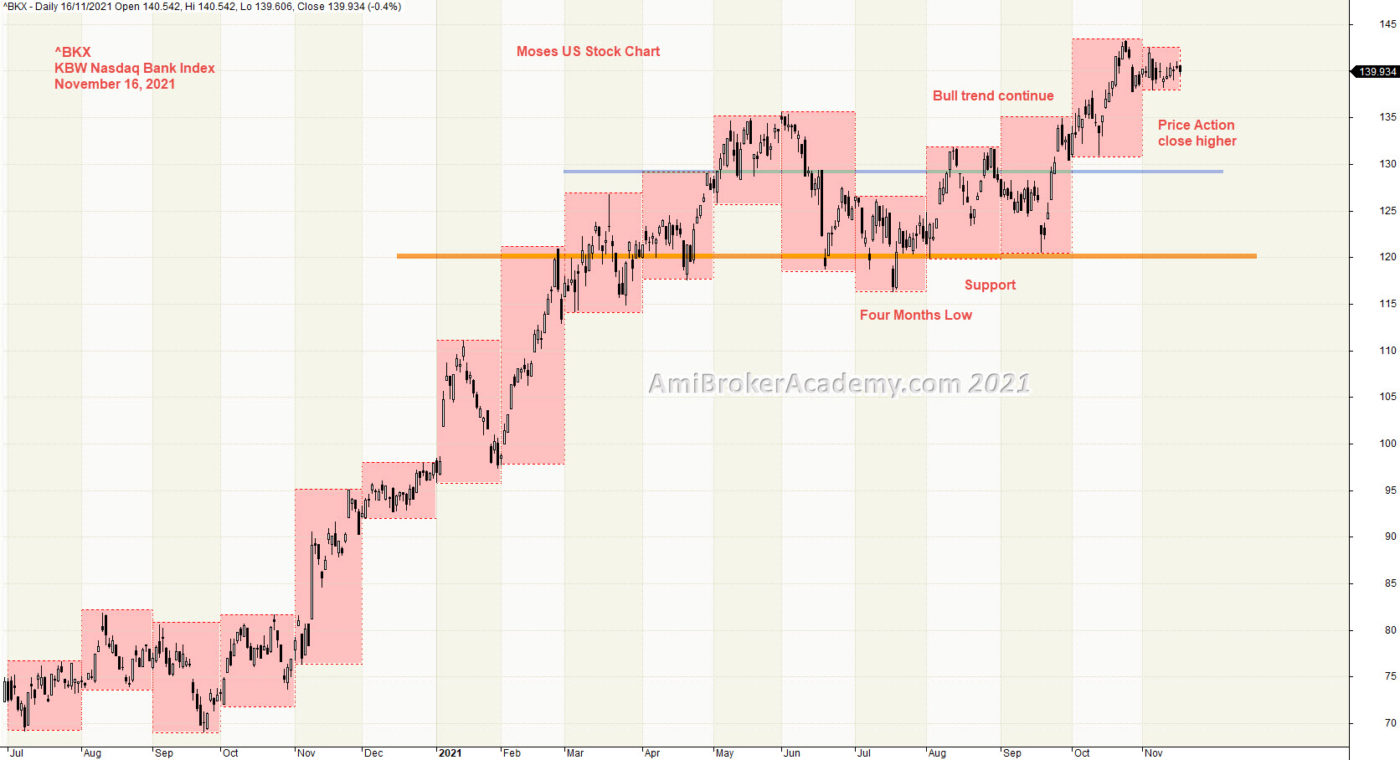
1) KBW Nasdaq Bank Index Month High Low from last July
Picture worth a thousand words. Price Action breakout from resistance. Price action pullback and supported by resistance turns support. Four month low on the support line. Strong right? Strong. Ask me will the price action continue to go higher. Answer is price action first must pullback to test the support before fall below.
See chart.
We use box to box the month high low.
If you are a buy and hold strategist, Will you continue to add more? Manage your risk.
Suggestion, look for pullback and buy near support.
20211116 KBW Nasdaq Bank Index Month High Low from last July
Moses Power Charting
Official AmiBrokerAcademy.com Charting
Disclaimer
The above result is for illustration purpose. It is meant to be used for learning buy or sell signals. We do not recommend for any particular stocks. If particular stocks of such are mentioned, they are meant as a demonstration of Amibroker as a powerful charting software. Amibroker is a charting software, it can program to scan the stocks for buy and sell signals. Or backtest for any trading strategy or technique.
We post script generated signals. Not all scan results are shown here depending on selection criterial. The MACD signal should use with price action. Users must understand what MACD and price action are all about before using them. If necessary you should attend a course to learn more on Technical Analysis (TA) and Moving Average Convergence Divergence, MACD.
Once again, the website does not guarantee any results or investment return based on the information and instruction you have read here. It should be used as learning aids only and if you decide to trade real money, all trading decision should be your own.
We learn from many past and present great traders. Kudo to these master.
Welcome to AmiBroker Academy dot com, amibrokeracademy.com.
If There is Only One Chart This is It
This is not a site that provides buy or sell signals directly. We read the stock chart bar by bar. If you understand what we read, you will get the buy or sell idea. Have fun!
Buy or Sell, you decide
Trading is very simple yet very difficult. Price is either up or down. But catch the right move is not easy. I believe many must have missed the falling knife. Now, many will be watching the topping. Can any catch the topping? Will see.
Up Down or Sideways
Trading is all probability. The price action is either up, down or sideways.
Trade what you see. Manage your risk.
Our Believe – Buy Support Sell Resistance.
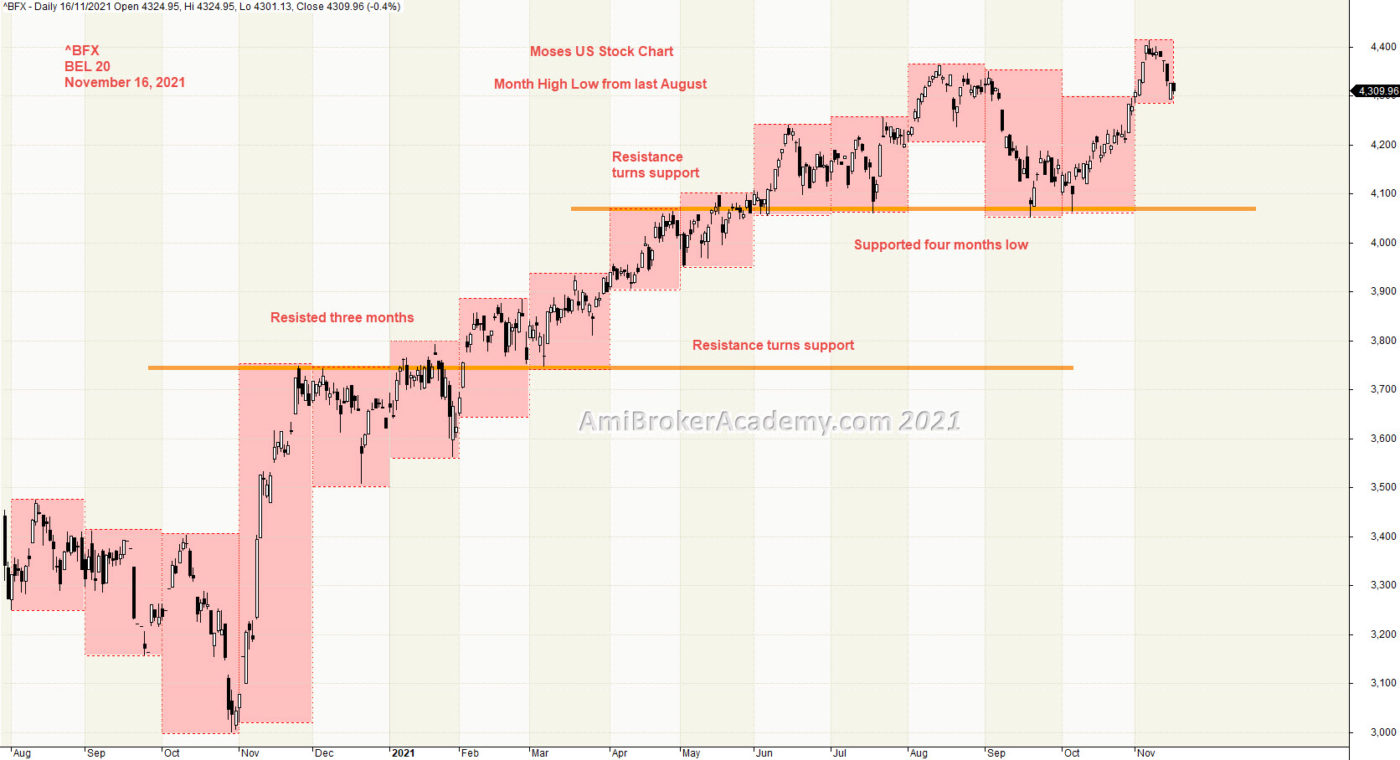
1) BEL 20 Index Month High Low
Picture worth a thousand words. Price Action breakout from resistance. Pullback and supported by resistance turns support. Ask me will the price action continue to go higher. Answer is at least the price action will have to breakout below support before go lower.
See chart.
We use box to box the month high low.
If you are a buy and hold strategist, Will you continue to add more? Manage your risk.
Suggestion to buy near support.
20211116 BEL 20 Index Month High Low
Moses Power Charting
Official AmiBrokerAcademy.com Charting
Disclaimer
The above result is for illustration purpose. It is meant to be used for learning buy or sell signals. We do not recommend for any particular stocks. If particular stocks of such are mentioned, they are meant as a demonstration of Amibroker as a powerful charting software. Amibroker is a charting software, it can program to scan the stocks for buy and sell signals. Or backtest for any trading strategy or technique.
We post script generated signals. Not all scan results are shown here depending on selection criterial. The MACD signal should use with price action. Users must understand what MACD and price action are all about before using them. If necessary you should attend a course to learn more on Technical Analysis (TA) and Moving Average Convergence Divergence, MACD.
Once again, the website does not guarantee any results or investment return based on the information and instruction you have read here. It should be used as learning aids only and if you decide to trade real money, all trading decision should be your own.
We learn from many past and present great traders. Kudo to these master.
Welcome to AmiBroker Academy dot com, amibrokeracademy.com.
If There is Only One Chart This is It
This is not a site that provides buy or sell signals directly. We read the stock chart bar by bar. If you understand what we read, you will get the buy or sell idea. Have fun!
Buy or Sell, you decide
Trading is very simple yet very difficult. Price is either up or down. But catch the right move is not easy. I believe many must have missed the falling knife. Now, many will be watching the topping. Can any catch the topping? Will see.
Up Down or Sideways
Trading is all probability. The price action is either up, down or sideways.
Trade what you see. Manage your risk.
Our Believe – Buy Support Sell Resistance.
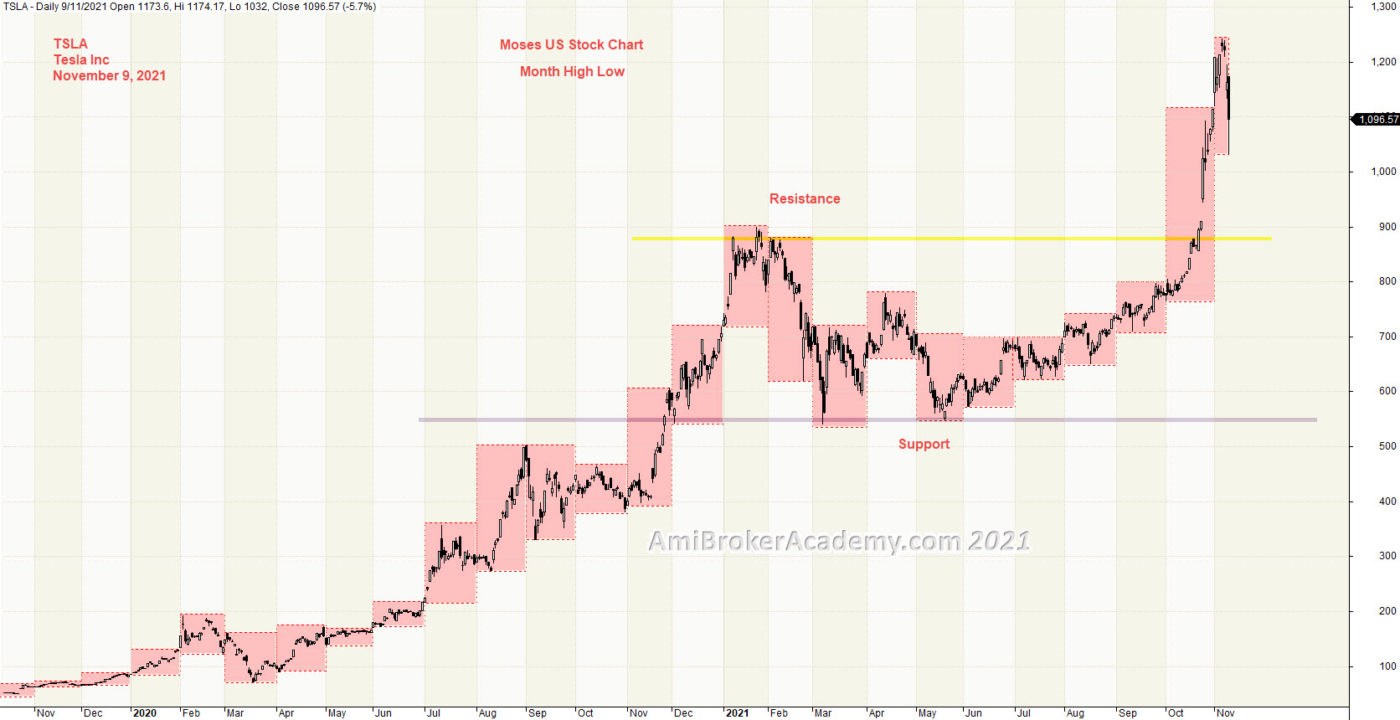
1) Tesla Inc and Month High Low
Picture worth a thousand words. Price Action breakout higher. Pullback and test the resistance. Price Action breakout from the last resistance. Now price action pullback.
See chart.
We use box to box the month high low.
If you are a buy and hold strategist, Will you sell or add more? Manage your risk.
Suggestion to buy near support. Do not catch the falling knife. Have fun!
20211109 Tesla Inc Month High Low
Moses Power Charting
Official AmiBrokerAcademy.com Charting
Disclaimer
The above result is for illustration purpose. It is meant to be used for learning buy or sell signals. We do not recommend for any particular stocks. If particular stocks of such are mentioned, they are meant as a demonstration of Amibroker as a powerful charting software. Amibroker is a charting software, it can program to scan the stocks for buy and sell signals. Or backtest for any trading strategy or technique.
We post script generated signals. Not all scan results are shown here depending on selection criterial. The MACD signal should use with price action. Users must understand what MACD and price action are all about before using them. If necessary you should attend a course to learn more on Technical Analysis (TA) and Moving Average Convergence Divergence, MACD.
Once again, the website does not guarantee any results or investment return based on the information and instruction you have read here. It should be used as learning aids only and if you decide to trade real money, all trading decision should be your own.
We learn from many past and present great traders. Kudo to these master.
Welcome to AmiBroker Academy dot com, amibrokeracademy.com.
If There is Only One Chart This is It
This is not a site that provides buy or sell signals directly. We read the stock chart bar by bar. If you understand what we read, you will get the buy or sell idea. Have fun!
Buy or Sell, you decide
Trading is very simple yet very difficult. Price is either up or down. But catch the right move is not easy. I believe many must have missed the falling knife. Now, many will be watching the topping. Can any catch the topping? Will see.
Up Down or Sideways
Trading is all probability. The price action is either up, down or sideways.
Trade what you see. Manage your risk.
Our Believe – Buy Support Sell Resistance.
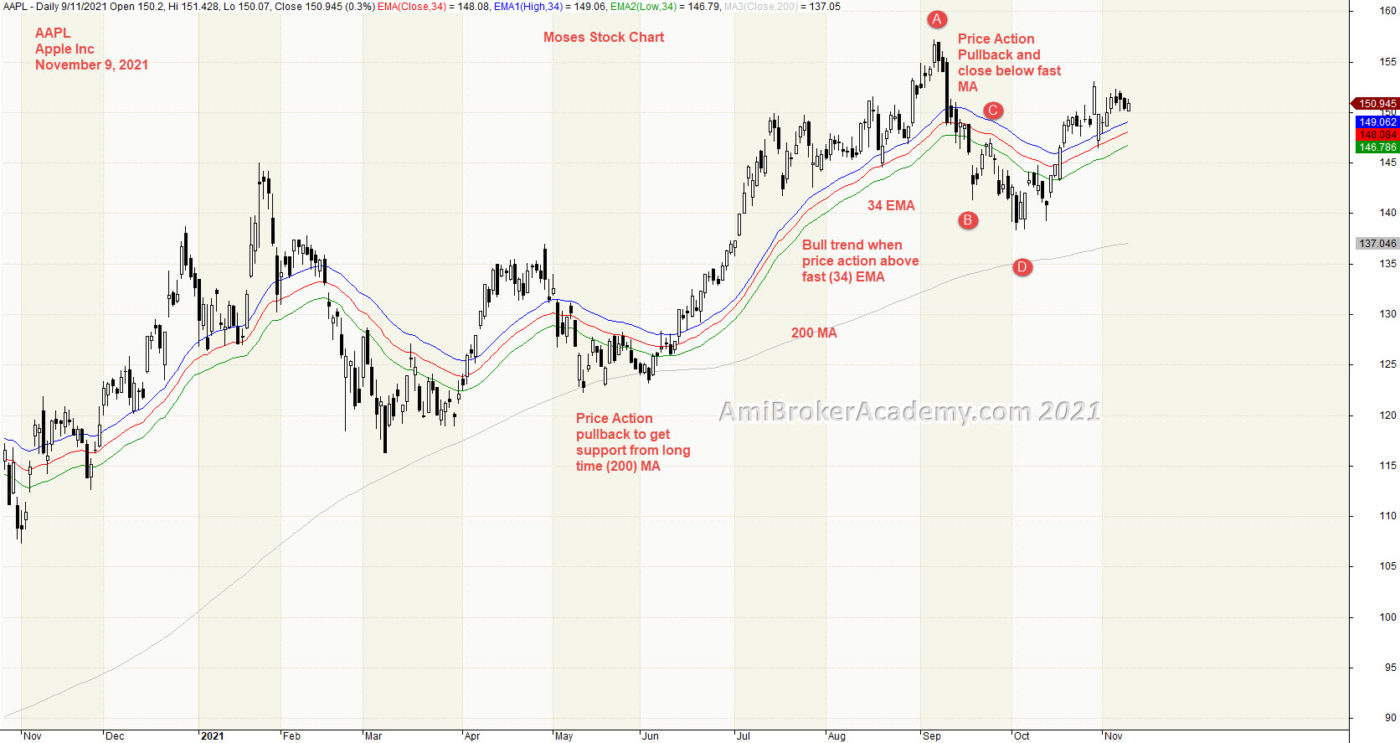
1) Apple Inc and River
Picture worth a thousand words. Price Action breakout higher. Price Action pullback and goes below River. River is a moving average band, formed by high, low and close of 34 EMA. When River slops up and price action above RIver, bull trend. When price action below River, reversing.
See chart.
Old school uses many moving average.
If you are a buy and hold strategist, Will you sell or add more? Manage your risk.
20211109 Apple Inc and River
Moses Power Charting
Official AmiBrokerAcademy.com Charting
Disclaimer
The above result is for illustration purpose. It is meant to be used for learning buy or sell signals. We do not recommend for any particular stocks. If particular stocks of such are mentioned, they are meant as a demonstration of Amibroker as a powerful charting software. Amibroker is a charting software, it can program to scan the stocks for buy and sell signals. Or backtest for any trading strategy or technique.
We post script generated signals. Not all scan results are shown here depending on selection criterial. The MACD signal should use with price action. Users must understand what MACD and price action are all about before using them. If necessary you should attend a course to learn more on Technical Analysis (TA) and Moving Average Convergence Divergence, MACD.
Once again, the website does not guarantee any results or investment return based on the information and instruction you have read here. It should be used as learning aids only and if you decide to trade real money, all trading decision should be your own.
We learn from many past and present great traders. Kudo to these master.
Welcome to AmiBroker Academy dot com, amibrokeracademy.com.
If There is Only One Chart This is It
This is not a site that provides buy or sell signals directly. We read the stock chart bar by bar. If you understand what we read, you will get the buy or sell idea. Have fun!
Buy or Sell, you decide
Trading is very simple yet very difficult. Price is either up or down. But catch the right move is not easy. I believe many must have missed the falling knife. Now, many will be watching the topping. Can any catch the topping? Will see.
Up Down or Sideways
Trading is all probability. The price action is either up, down or sideways.
Trade what you see. Manage your risk.
Our Believe – Buy Support Sell Resistance.
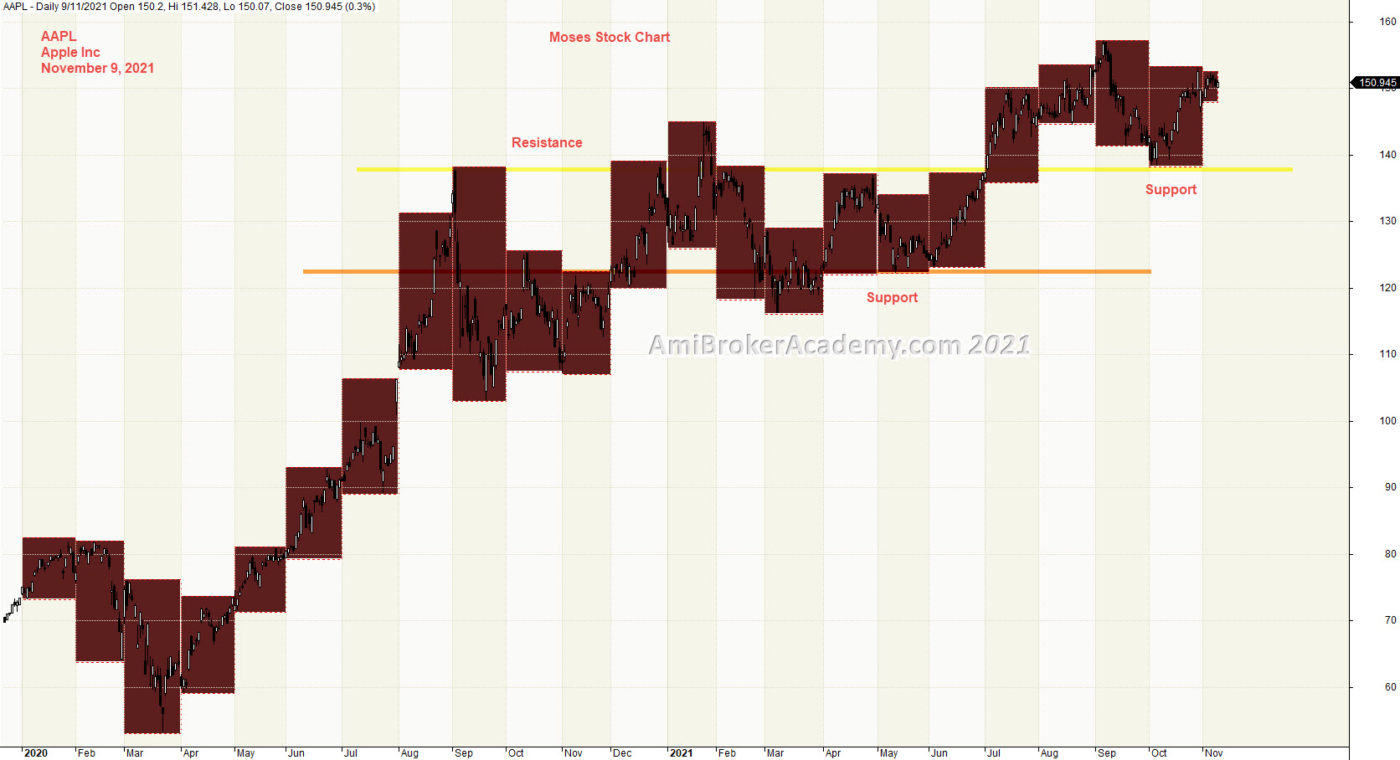
1) Apple Inc and Month High Low
Picture worth a thousand words. Price Action breakout and go higher. Price Action breakout again and go higher. We see price action moves sideways before breaking out further. Price Action is now near support zone.
See chart.
If you are a buy and hold strategist, Will you sell or add more? Manage your risk.
20211109 Apple Inc and Month High Low
Moses Power Charting
Official AmiBrokerAcademy.com Charting
Disclaimer
The above result is for illustration purpose. It is meant to be used for learning buy or sell signals. We do not recommend for any particular stocks. If particular stocks of such are mentioned, they are meant as a demonstration of Amibroker as a powerful charting software. Amibroker is a charting software, it can program to scan the stocks for buy and sell signals. Or backtest for any trading strategy or technique.
We post script generated signals. Not all scan results are shown here depending on selection criterial. The MACD signal should use with price action. Users must understand what MACD and price action are all about before using them. If necessary you should attend a course to learn more on Technical Analysis (TA) and Moving Average Convergence Divergence, MACD.
Once again, the website does not guarantee any results or investment return based on the information and instruction you have read here. It should be used as learning aids only and if you decide to trade real money, all trading decision should be your own.
We learn from many past and present great traders. Kudo to these master.
Welcome to AmiBroker Academy dot com, amibrokeracademy.com.
If There is Only One Chart This is It
This is not a site that provides buy or sell signals directly. We read the stock chart bar by bar. If you understand what we read, you will get the buy or sell idea. Have fun!
Buy or Sell, you decide
Trading is very simple yet very difficult. Price is either up or down. But catch the right move is not easy. I believe many must have missed the falling knife. Now, many will be watching the topping. Can any catch the topping? Will see.
Up Down or Sideways
Trading is all probability. The price action is either up, down or sideways.
Trade what you see. Manage your risk.
Our Believe – Buy Support Sell Resistance.
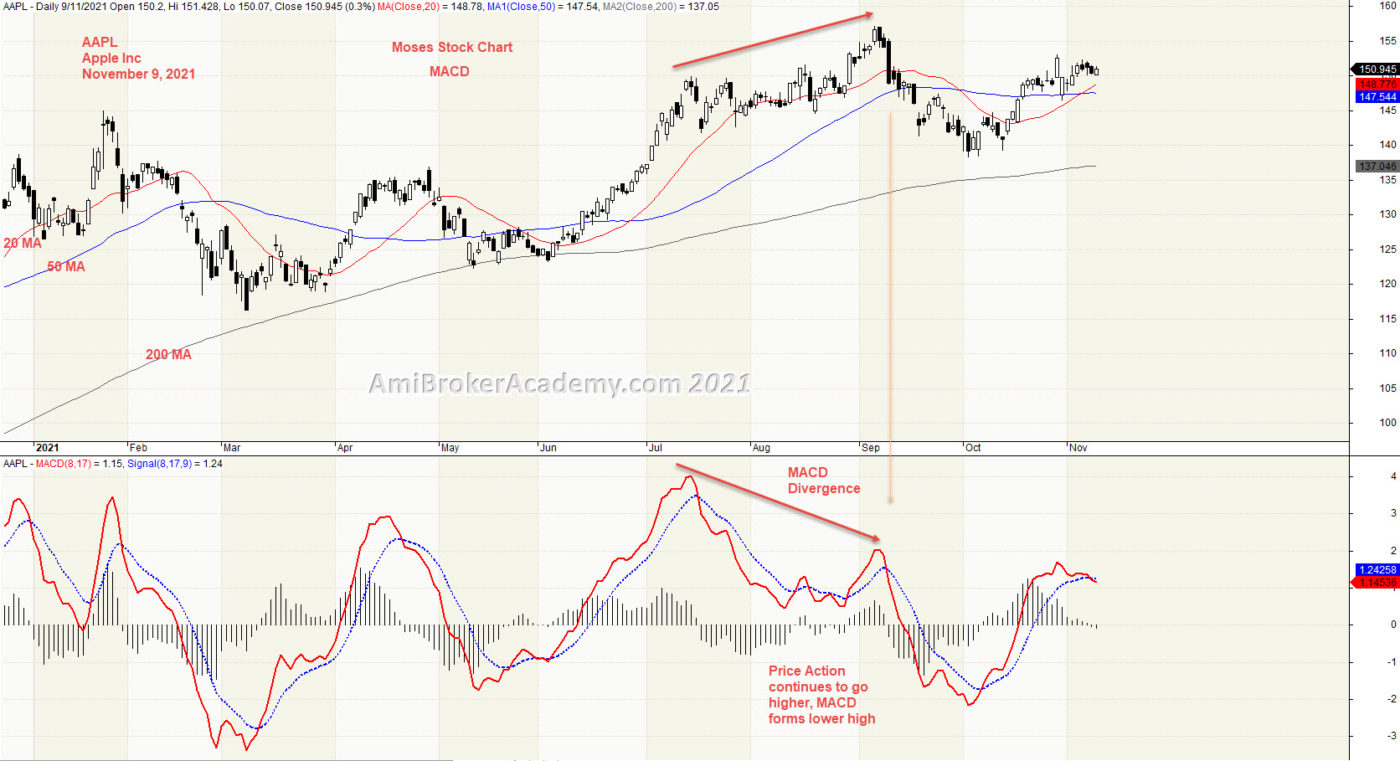
1) Apple Inc and MACD Divergence
Picture worth a thousand words. Price Action continues go higher, but MACD forms lower high. Price Action may pullback as MACD get weaker. Price Action pullback to test the last high near beginning of 2021. Resistance turns support.
See chart.
If you are a buy and hold strategist, Will you sell or add more? Price Action pullback near last high near resistance. Manage your risk.
20211109 Apple Inc and MACD Divergence
Moses Power Charting
Official AmiBrokerAcademy.com Charting
Disclaimer
The above result is for illustration purpose. It is meant to be used for learning buy or sell signals. We do not recommend for any particular stocks. If particular stocks of such are mentioned, they are meant as a demonstration of Amibroker as a powerful charting software. Amibroker is a charting software, it can program to scan the stocks for buy and sell signals. Or backtest for any trading strategy or technique.
We post script generated signals. Not all scan results are shown here depending on selection criterial. The MACD signal should use with price action. Users must understand what MACD and price action are all about before using them. If necessary you should attend a course to learn more on Technical Analysis (TA) and Moving Average Convergence Divergence, MACD.
Once again, the website does not guarantee any results or investment return based on the information and instruction you have read here. It should be used as learning aids only and if you decide to trade real money, all trading decision should be your own.
We learn from many past and present great traders. Kudo to these master.
Welcome to AmiBroker Academy dot com, amibrokeracademy.com.
If There is Only One Chart This is It
This is not a site that provides buy or sell signals directly. We read the stock chart bar by bar. If you understand what we read, you will get the buy or sell idea. Have fun!
Buy or Sell, you decide
Trading is very simple yet very difficult. Price is either up or down. But catch the right move is not easy. I believe many must have missed the falling knife. Now, many will be watching the topping. Can any catch the topping? Will see.
Up Down or Sideways
Trading is all probability. The price action is either up, down or sideways.
Trade what you see. Manage your risk.
Our Believe – Buy Support Sell Resistance.
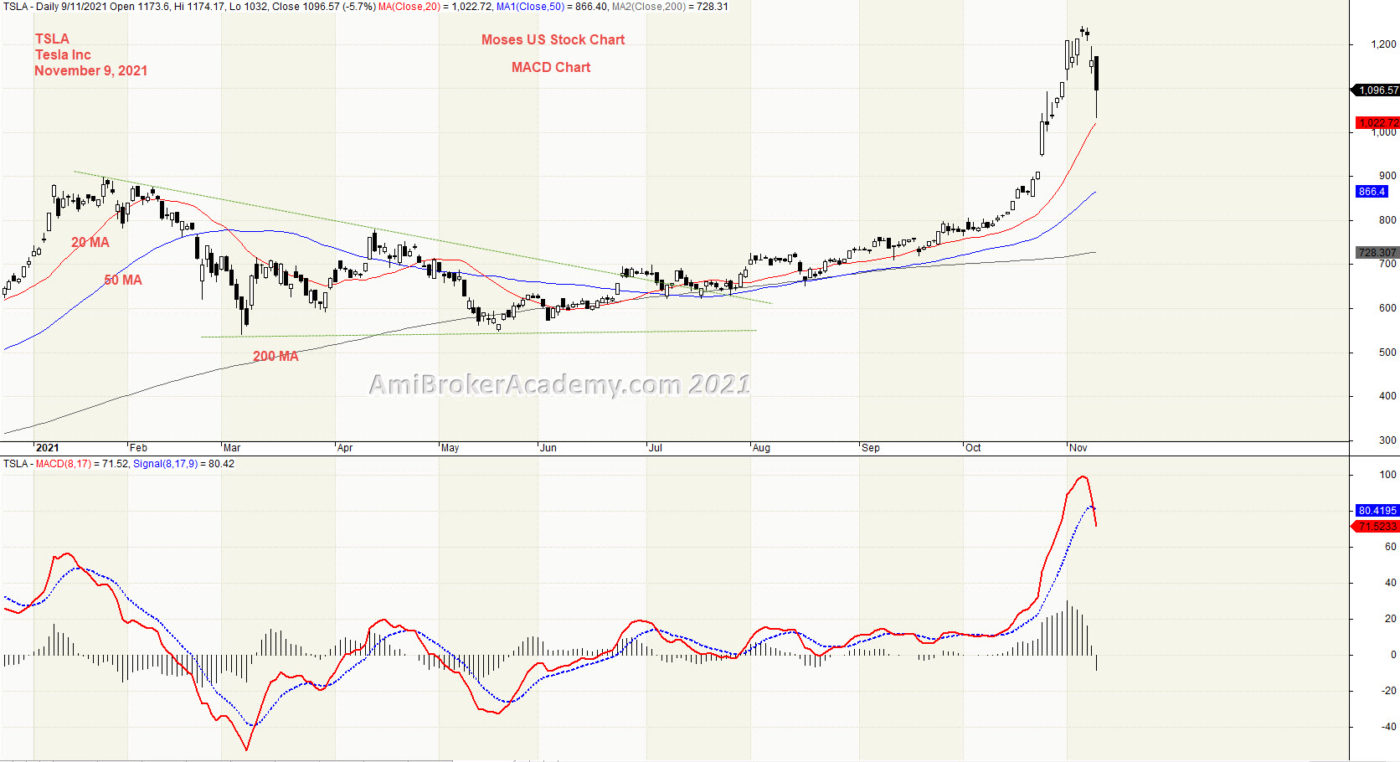
1) Tesla Inc and MACD
Picture worth a thousand words. Price Action breakout the last high near start of 2021. See chart. Price Action is now pullback.
See chart.
If you are a buy and hold strategist, Will you sell or add more? Price Action pullback near last high near resistance. Manage your risk.
20211109 Tesla Inc and MACD
Moses Power Charting
Official AmiBrokerAcademy.com Charting
Disclaimer
The above result is for illustration purpose. It is meant to be used for learning buy or sell signals. We do not recommend for any particular stocks. If particular stocks of such are mentioned, they are meant as a demonstration of Amibroker as a powerful charting software. Amibroker is a charting software, it can program to scan the stocks for buy and sell signals. Or backtest for any trading strategy or technique.
We post script generated signals. Not all scan results are shown here depending on selection criterial. The MACD signal should use with price action. Users must understand what MACD and price action are all about before using them. If necessary you should attend a course to learn more on Technical Analysis (TA) and Moving Average Convergence Divergence, MACD.
Once again, the website does not guarantee any results or investment return based on the information and instruction you have read here. It should be used as learning aids only and if you decide to trade real money, all trading decision should be your own.
We learn from many past and present great traders. Kudo to these master.
Welcome to AmiBroker Academy dot com, amibrokeracademy.com.
If There is Only One Chart This is It
This is not a site that provides buy or sell signals directly. We read the stock chart bar by bar. If you understand what we read, you will get the buy or sell idea. Have fun!
Buy or Sell, you decide
Trading is very simple yet very difficult. Price is either up or down. But catch the right move is not easy. I believe many must have missed the falling knife. Now, many will be watching the topping. Can any catch the topping? Will see.
Up Down or Sideways
Trading is all probability. The price action is either up, down or sideways.
Trade what you see. Manage your risk.
Our Believe – Buy Support Sell Resistance.
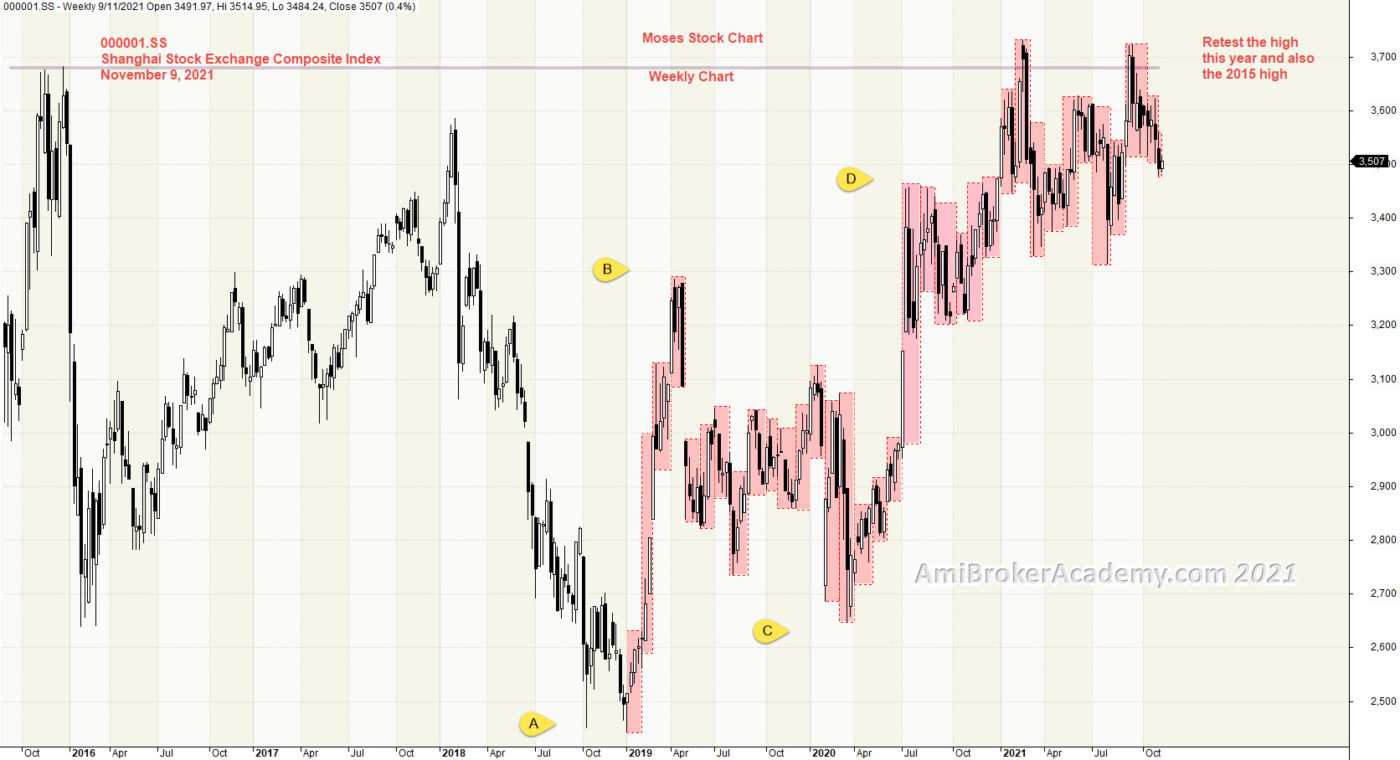
1) Shanghai Stock Exchange Composite Index Weekly Chart from 2016
Picture worth a thousand words. Price Action test the high again, and the high of year 2015. See chart. Price Action is now at a very strong level, high.
See chart.
If you are a buy and hold strategist, Will you add more? Price Action near resistance, maybe topping soon? Manage your risk.
20211109 Shanghai Stock Exchange Composite Index Weekly Chart from 2016
Moses Power Charting
Official AmiBrokerAcademy.com Charting
Disclaimer
The above result is for illustration purpose. It is meant to be used for learning buy or sell signals. We do not recommend for any particular stocks. If particular stocks of such are mentioned, they are meant as a demonstration of Amibroker as a powerful charting software. Amibroker is a charting software, it can program to scan the stocks for buy and sell signals. Or backtest for any trading strategy or technique.
We post script generated signals. Not all scan results are shown here depending on selection criterial. The MACD signal should use with price action. Users must understand what MACD and price action are all about before using them. If necessary you should attend a course to learn more on Technical Analysis (TA) and Moving Average Convergence Divergence, MACD.
Once again, the website does not guarantee any results or investment return based on the information and instruction you have read here. It should be used as learning aids only and if you decide to trade real money, all trading decision should be your own.
We learn from many past and present great traders. Kudo to these master.