May 8, 2018
Thanks for visiting the site, AmiBrokerAcademy.com.
Let’s study CenturyLink stock performance.
US Stock Analysis – Chart Stories
CTL CenturyLink Inc and Support Resistance
Study CenturyLink stock price using support resistance, using month high low as support resistance, see the breakout of the support resistance. Picture worth a thousand words. Manage your risk.
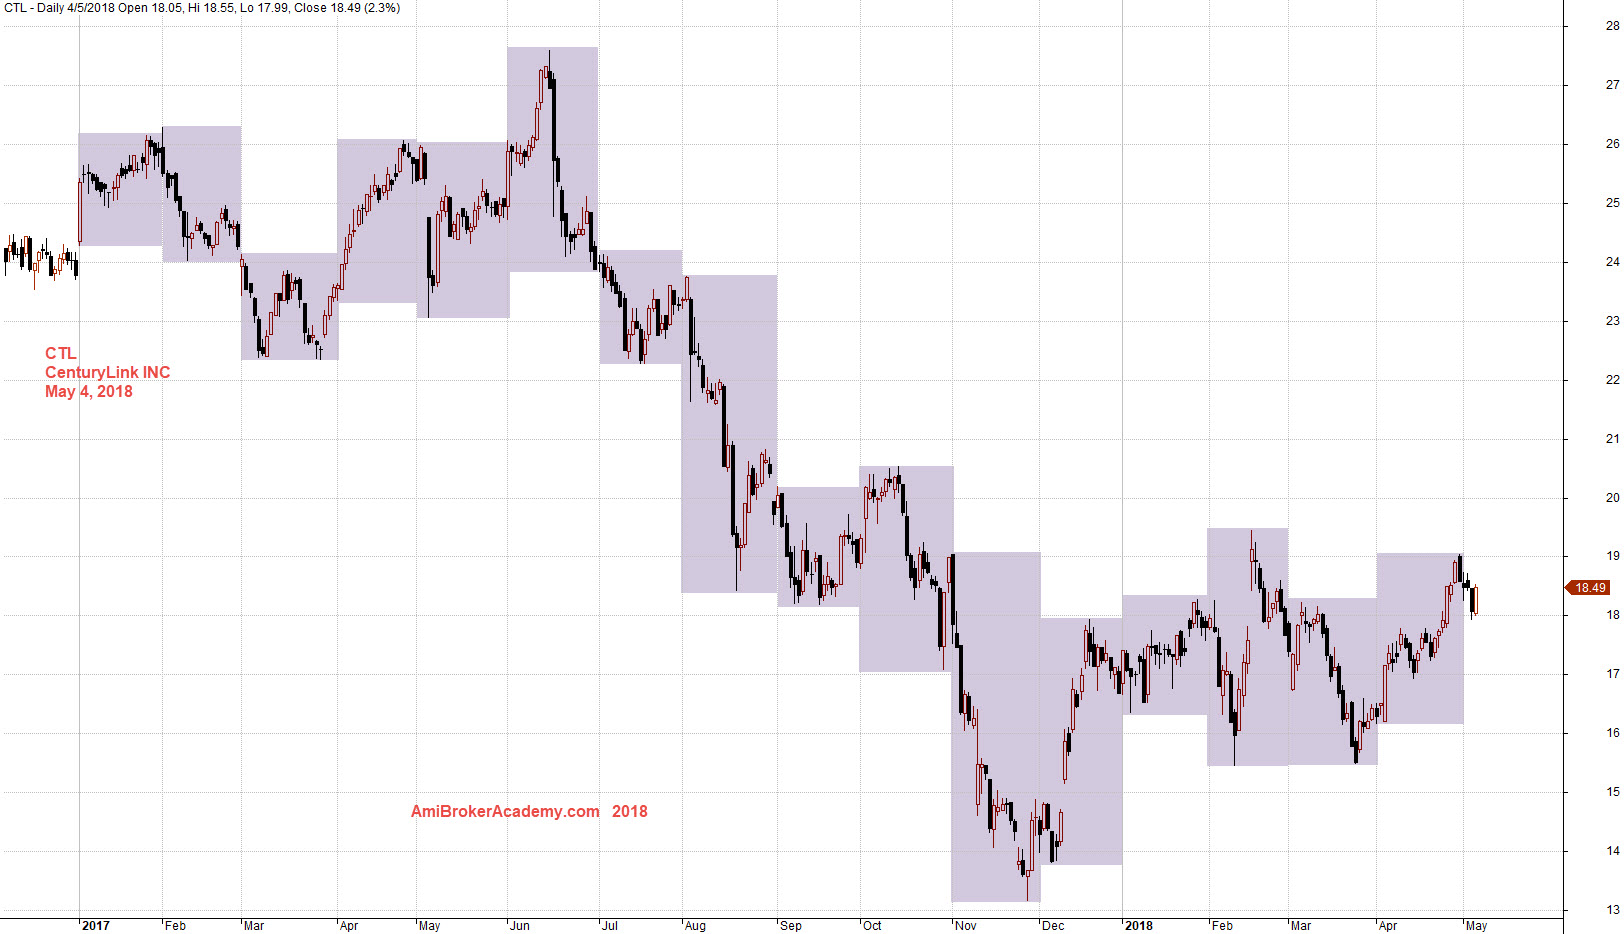
May 4, 2018 CenturyLink Inc and Support Resistance
CTL CenturyLink Inc and MACD
Picture worth a thousand words, see chart for more. Manage your risk.
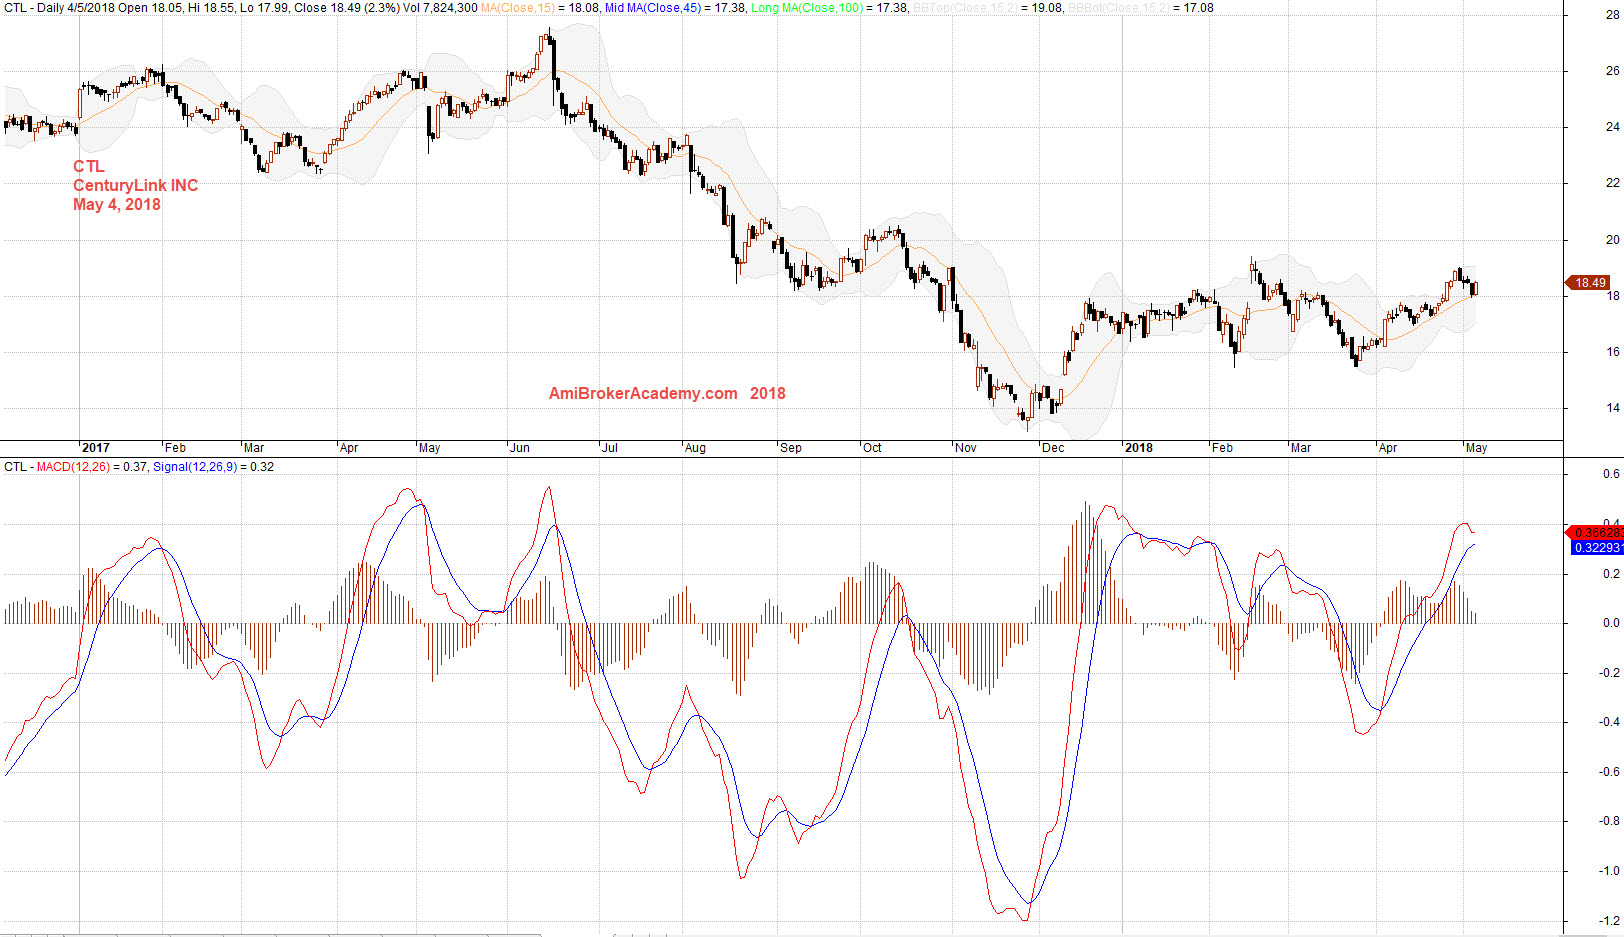
May 4, 2018 CenturyLink Inc and MACD
CTL CenturyLink Inc and MA Wave
Picture worth a thousand words, see chart the stock price after June last year when the price action closed below the MA band and stay below the MA band till December, the MA band has a very deep slop. The price action begin the zip up. But becomes zipping up and down of the MA band. Manage your risk.
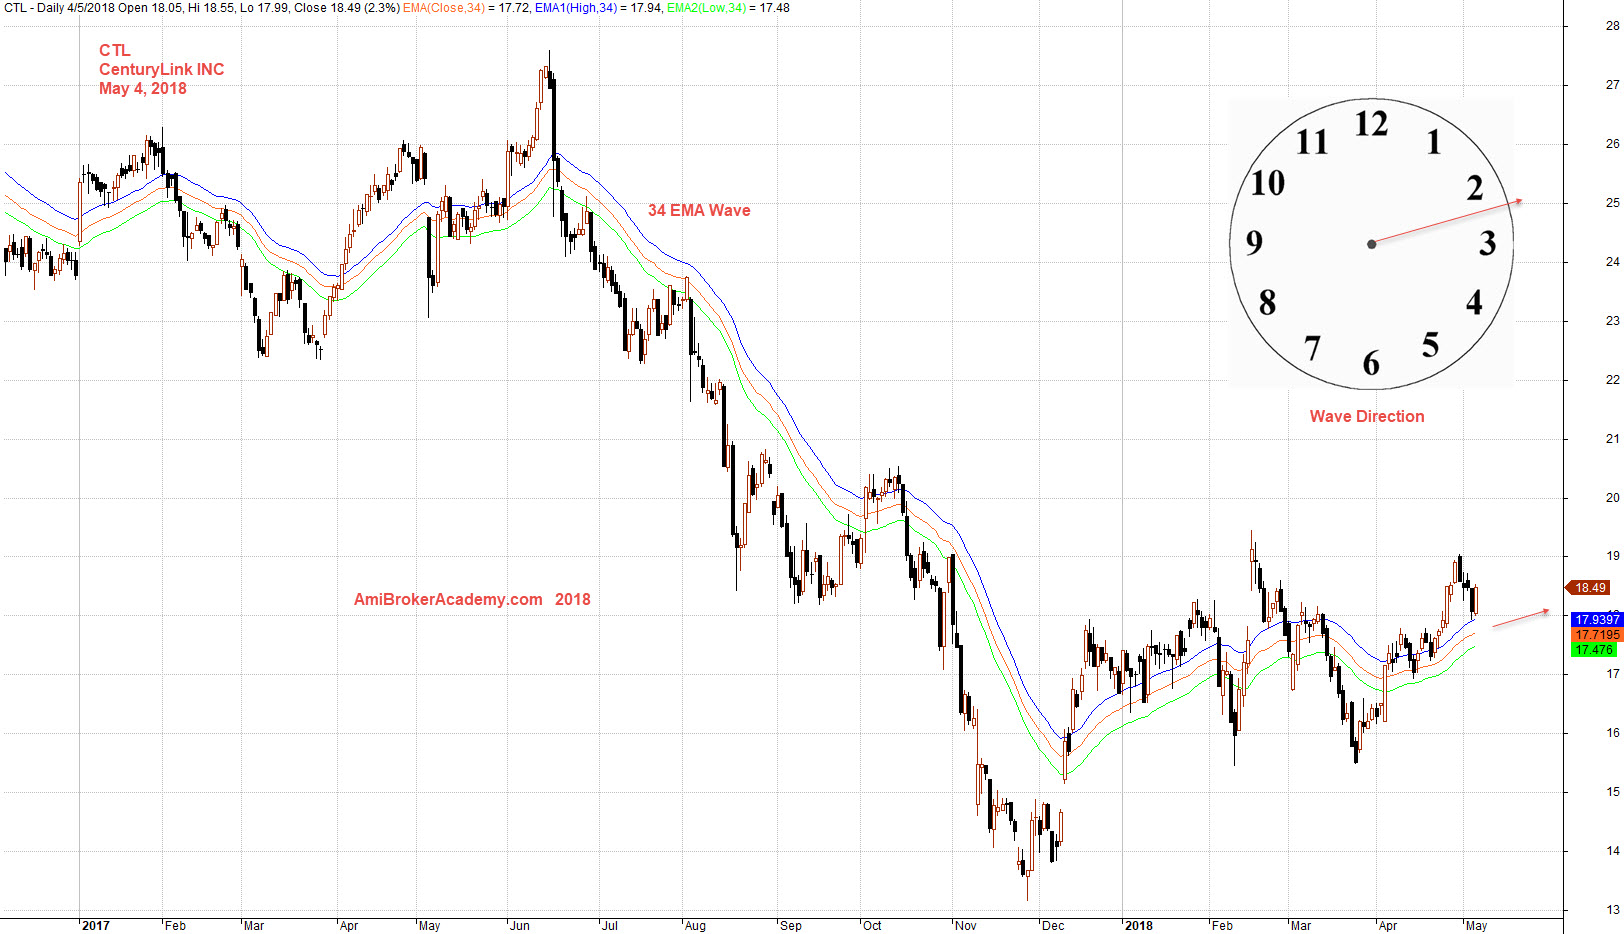
May 4, 2018 CenturyLink Inc and MA Wave
Moses Stock Analysis
AmiBrokerAcademy.com
Disclaimer: All information, data and material contained, presented, or provided on amibrokeracademy.com is for educational purposes only. It is not to be construed or intended as providing trading or legal advice. Decisions you make about your trading or investment are important to you and your family, therefore should be made in consultation with a competent financial advisor or professional. We are not financial advisor and do not claim to be. Any views expressed here-in are not necessarily those held by amibrokeracademy.com. You are responsible for your trade decision and wealth being.