Welcome to AmiBrokerAcademy.com website.
Alibaba Group Holding Limited BABA Stock Scan
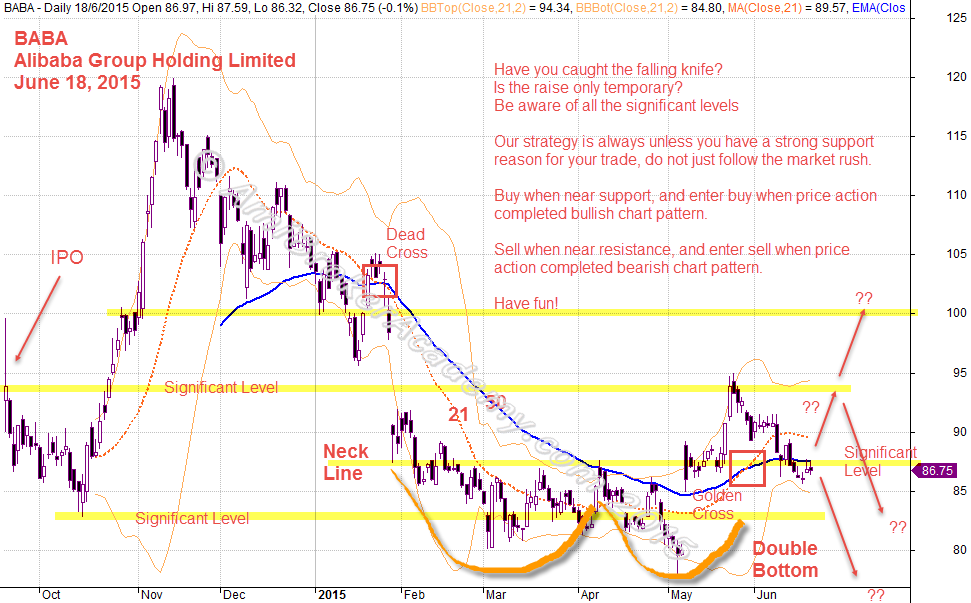
After the peak in last November, the price action has been drifted south. Finally, the fall come to a stop in March this year. The price action retest the same low again in May, 2015.
The price action retrace back to the same high at IPO within the same month after the retest. However, the closed price of IPO seem to be a significant level. The price get reject since then, will the neck line give the price action the necessary support to stop the price from falling further. Will see!
June 18, 2015 Alibaba Group Holding
What is our Trade Strategy
General guideline, buy when price action bounce above moving average, sell when price rejected by moving average.
Only enter buy after price completed bullish chart pattern (candlestick) as well as the price action is near support, and enter sell after price completed bearish chart pattern (candlestick) as well as the price action is near resistant.
Consider buy when price action rejected by neckline. But ready to cut lost when the Bear Trap fail, and don’t let the lost become big lost.
You can read about other US Stocks scan in this website.
Thanks for visiting the website.
Moses
DISCLAIMER
Site advice, “Stock trading is not a get rich quick scheme and it is high risk”.
Information provided here is of the nature of a general comment only and no intend to be specific for trading advice. It has prepared without regard to any particular investment objectives, financial situation or needs. Information should NOT be considered as an offer or enticement to buy, sell or trade.
You should seek advice from your broker, or licensed investment advisor, before taking any action.
The website does not guarantee any results or investment return based on the information and instruction you have read here. It should be used as learning aids.