May 11, 2018
Thank you for visiting the site.
US Stock Analysis – Chart Stories
Arbor Realty Trust and MA Wave
Study Arbor Realty Trust stock price using MA, Moving Average. See chart, picture worth a thousand words. We use high, low and close MAs with 34 period. The stock price bullish when the price action above MA, and bearish when stock price below MA. Bullish when stock price slopping up, bearish when stock price slopping down. Now, the stock price goes sideways. Manage your risk.
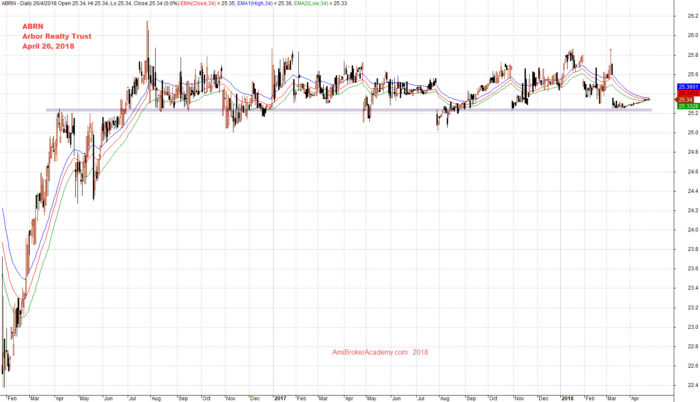
April 26, 2018 Arbor Realty Trust Charting
Moses Stock Analysis
AmiBrokerAcademy.com
Disclaimer: All information, data and material contained, presented, or provided on amibrokeracademy.com is for educational purposes only. It is not to be construed or intended as providing trading or legal advice. Decisions you make about your trading or investment are important to you and your family, therefore should be made in consultation with a competent financial advisor or professional. We are not financial advisor and do not claim to be. Any views expressed here-in are not necessarily those held by amibrokeracademy.com. You are responsible for your trade decision and wealth being.