US Stock Analysis, Alpha and Omega Semiconductor Limited, AOSL
AOSL 52 week high was $14.60 and low was $7.26.
Fundamental
April 29, 2010 Alpha and Omega Semiconductor Limited listed on NASDAQ on April 29, 2010. AOSL engages in the design, development, and a global supplier of a range of power semiconductors. The company offers power discrete product, Power MOSFET, and power ICs. The company products are used in notebooks, netbooks, flat panel displays, mobile phone battery packs, set-top boxes, portable media players, and power supplies. Alpha and Omega Semiconductor Limited is based in Hamilton, Bermuda. The company sells its products through distributors.
The power discrete products are comprising trench MOSFETs, electrostatic discharge, protected MOSFETs, and SRFETs;.
Technical Analysis
Moving Average
Moving average, MA is used to smooth out price zigzag that confuse trend analysis. Moving averages are used to emphasize the price direction of a trend.
Up sloping moving averages showing uptrend and acting as support
Down sloping moving averages showing downtrend and acting as resistance
Flat moving averages showing sideway movement and acting as both support and resistance
Golden Cross
Golden Cross is the fast moving average (eg 20 days EMA) cross up slow moving average (eg 50 days EMA) and the moving averages act as a support.
Dead Cross
Dead Cross is the fast moving average cross below slow moving average and the moving averages act as a resistance.
Moving Average Convergence Divergence, MACD
MACD oscillates above and below zero, without any upper or lower limits. MACD is useful for spotting major trend reversal. MACD is a good measurement of price momentum. It tells whether price is moving up or down, faster or slower.
Stocks Analysis
December 9, 2011, the market opened at $8.14, the bull drove it up to $8.5, the market closed at $8.4. The bear was very weak; the low of the day was $8.1. The price has re-bounced at the critical support level. The price has supported at this level for three times. But the MACD has showed weakness. If the support could not support the price, the price could move even lower. The NASDAQ shows the overall market emotions. The NASDAQ definitely affects the performance of AOSL.
AOSL Daily Chart with NASDAQ correlation
What is the story chart had told you? Trade what you see and not what you think. Is there any entry signal? What is the risk? Are you investor or trader?
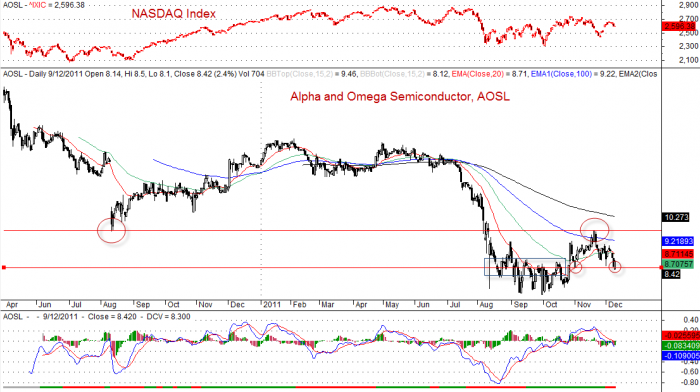
Alpha and Omega Semiconductor, AOSL and NASDAQ Daily Chart
AOSL Daily Chart with NASDAQ close up view
What is your trading strategy? Is the indicator signalled the price reversal? So the price will continue to stay lower. Or is the price at the critical support? Trade what you see and not what you think. Play your entry, stop loss and exit point. Plan your trade and trade your plan.
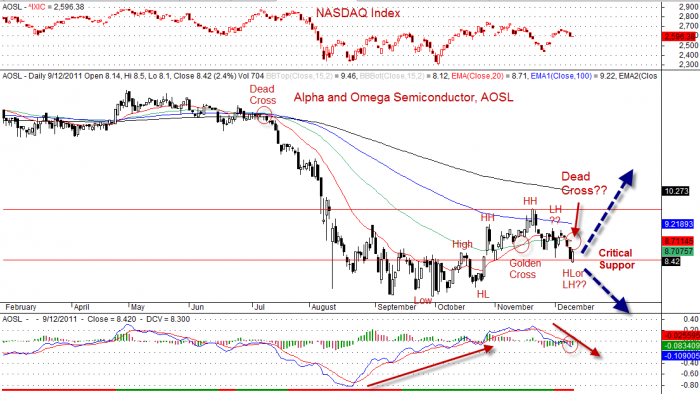
Alpha and Omega Semiconductor, AOSL and NASDAQ Daily Chart Close up View
Disclaimer
The above result is for education purpose. It is not meant to be used for buy or sell decision. We do not recommend any particular stocks. If particular stock of such is mentioned, they are meant as demonstration of Amibroker as a powerful charting software, what Technical Analysis is, some indicators such as MACD, Support and Resistance, and Moving Averages.
Once again, the website does not guarantee any results or investment return based on the information and instruction you have read here.