April 3, 2014 Singapore Stocks Market
Moses’s Stocks Corner at amibrokeracademy.com.
Twenty Six (26)Years of Singapore Stock Market Straits Times Index from 1988 to 2014 End March
26 Years Straits Times Index, STI is moving in trend channel, trendline joining the tops and trendline bottoms. Joining bottom in rising market, the parallel line joins the tops, the area between the two parallel lines is known as trend channel.
It is always possible to find sub trend channels within a bigger channel.
The following is the Straits Times Index since 1988 till end March 2014. For your reference.
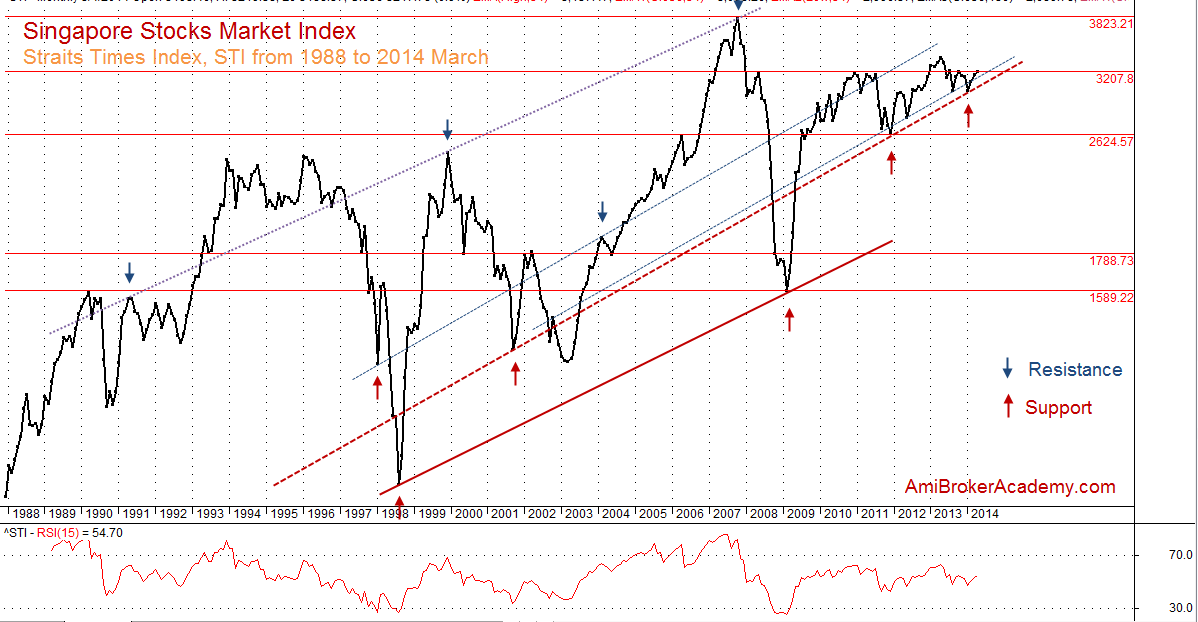
Straits Times Index, STI for Singapore Stocks Market from 1988 till April 2014
Moses
DISCLAIMER
Information provided here is of the nature of a general comment only and no intend to be specific for trading advice. It has prepared without regard to any particular investment objectives, financial situation or needs. Information should not be considered as an offer or enticement to buy, sell or trade.
You should seek advice from your broker, or licensed investment advisor, before taking any action.
Once again, the website does not guarantee any results or investment return based on the information and instruction you have read here. It should be used as learning aids only and if you decide to trade real money, all trading decision should be your own.