27 December, 2018
Think think got more things.
Thanks for visiting the site.
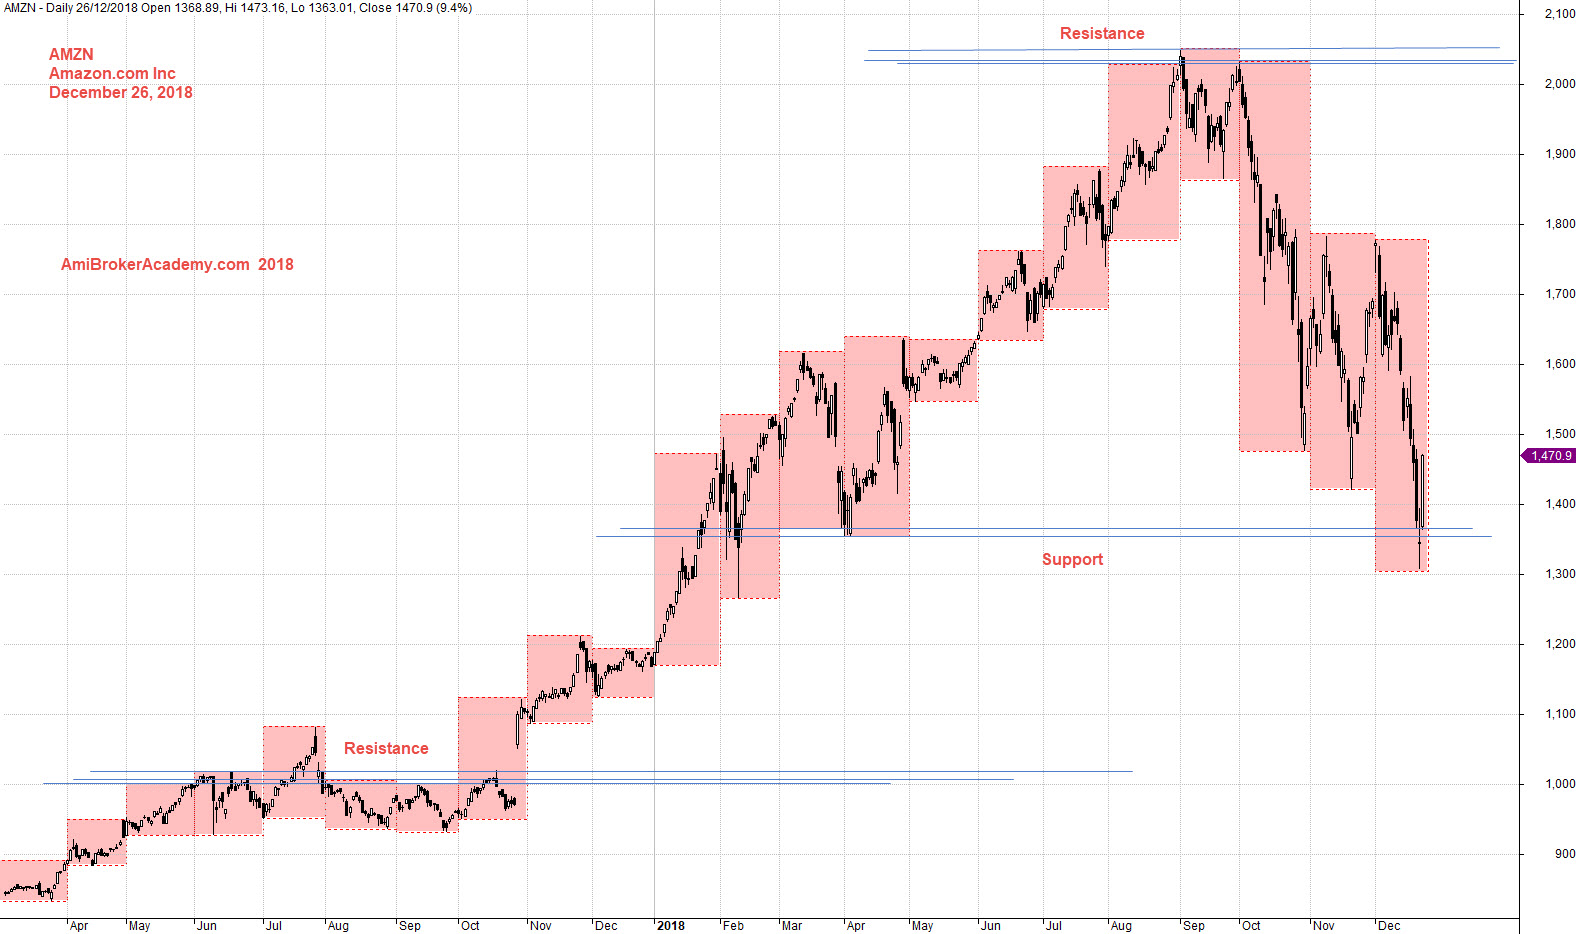
AMZN Amazon.com Inc Daily Chart
We believe in Buy Low Sell High
in other words Buy Support Sell Resistance
How to draw a support resistance?
One way to draw support resistance, that is reference to the month high low. See the following chart as an example.
Study Amazon.com Inc chart, we see price action test near the high 2000 dollars. After retest the high, the price action drift south.
See the price action near 1300 and 1400 dollars region, many two months low stop there.
Trade with your eyes open.
if you can see the full chart, “press Ctrl and -” to zoom out and see the entire chart.
Moses US Stock Chart Analysis
AmiBrokerAcademy.com
Disclaimer
The above result is for illustration purpose. It is not meant to be used for buy or sell decision. We do not recommend any particular stocks. If particular stocks of such are mentioned, they are meant as demonstration of Amibroker as a powerful charting software and MACD. Amibroker can program to scan the stocks for buy and sell signals.
These are script generated signals. Not all scan results are shown here. The MACD signal should use with price action. Users must understand what MACD and price action are all about before using them. If necessary you should attend a course to learn more on Technical Analysis (TA) and Moving Average Convergence Divergence, MACD.
Once again, the website does not guarantee any results or investment return based on the information and instruction you have read here. It should be used as learning aids only and if you decide to trade real money, all trading decision should be your own.