June 4, 2016
The AES Corporation Stock Analysis
The price action response to the Support and Resistance, the price action will not move north any further when at resistance. The price action will not fall any further when at support. The price action has been ranging since April 8, 2016 for eight weeks. From the chart, you see the price action has stopped b y the support turn resistance zone. MACD histogram has showed weakness, the price action may fail and move south when MACD continue to show weakness. Lock in and keep watch this stock.
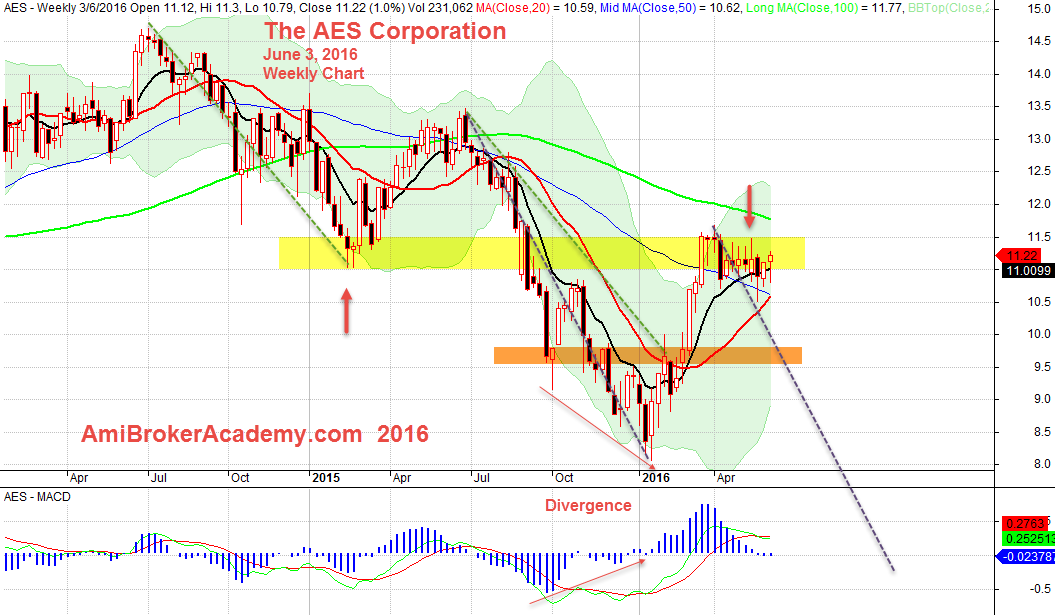
June 3, 2016 The AES Corporation Weekly Chart
MACD is a leading indicator on the direction change.
Thanks for visiting the site, you can find many other analysis and concepts on this site. Have fun!
Moses Stock Analysis and Scan
Disclaimer: All information, data and material contained, presented, or provided on amibrokeracademy.com is for educational purposes only. It is not to be construed or intended as providing trading or legal advice. Decisions you make about your trading or investment are important to you and your family, therefore should be made in consultation with a competent financial advisor or professional. We are not financial advisor and do not claim to be. Any views expressed here-in are not necessarily those held by amibrokeracademy.com. You are responsible for your trade decision and wealth being.
The site uses powerful charting software, AmiBroker charting software.