October 30, 2014
Technical Analysis is through studying price (y axis) and time (x axis) chart to understand the money flows, emotions into and out of the market. In Technical Analysis, the price and time have incorporate news, investor expectation, and market emotions.
All technical analysts have different understanding of the price and time chart. But, all have the same behavior; look left and think right.
In order for chartist to make the right decision, the chartist has to update his chart regularly.
So, let see what the new development of the Singapore Stock Market.
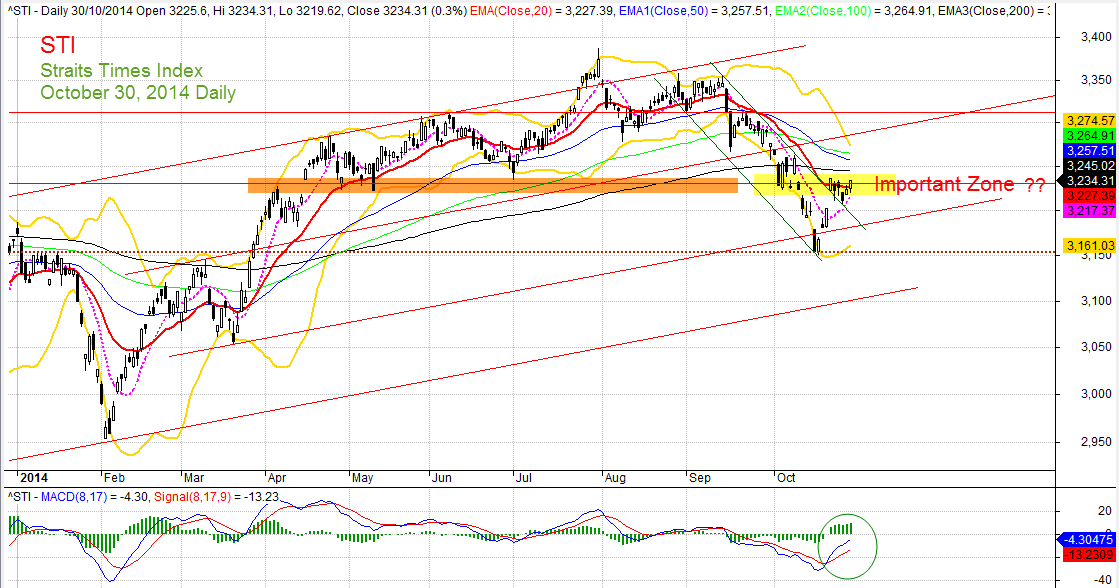
Singapore Stock Market Benchmark, Straits Times Index, STI October 30, 2014 Daily
What next? May be?
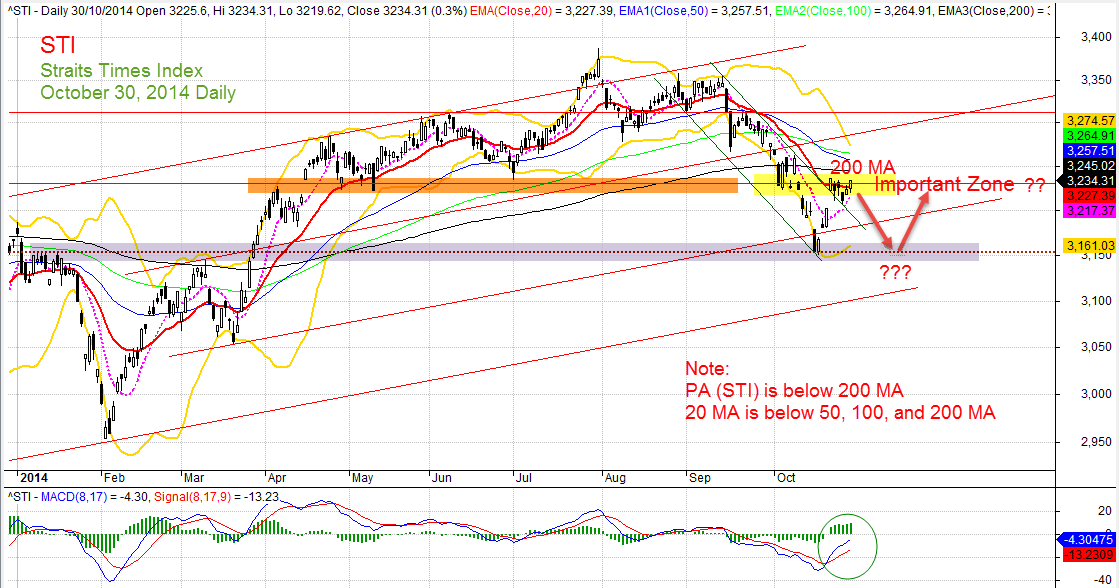
What’s Next? For Singapore Stock. See Analysis
Read other postings:
1) US Markets as a Leading Indicator? STI
2) What is next likely level might hold the “falling knife” – ST Index
3) Be Realistic! Moses’ Stock Analysis
4) Let the Profit Run! Straits Times Index
Stock trading is not a get rich quick scheme.
Thanks for visiting the site, AmiBrokerAcademy.com.
Moses
DISCLAIMER
Information provided here is of the nature of a general comment only and no intend to be specific for trading advice. It has prepared without regard to any particular investment objectives, financial situation or needs. Information should NOT be considered as an offer or enticement to buy, sell or trade.
You should seek advice from your broker, or licensed investment advisor, before taking any action.
Once again, the website does not guarantee any results or investment return based on the information and instruction you have read here. It should be used as learning aids.
Trading is personal. You are responsible for your own trading decision.
The comment is the author personal experience. There is no intent for your believe and follow.