Welcome to AmiBrokerAcademy.com.
This website here uses powerful charting software AmiBroker for charting and indicators.
The website provides free stock scan also.
Picture Worth a Thousand Words
Many of the answer is the additional lines and comments on the chart. See chart for more information.
Singapore ^STI Straits Times Index Analysis
There are number of trading strategy, reversal trading is one of the common strategy. In other words, traders are looking to trade the top or bottom.
For Straits Times Index, Singapore stock market index, you have missed the top. So, you are now looking for bottom. Is it bottom already? Now look at the chart carefully, the reason for draw out so many years of data are not for show or fun! From the chart when you connect the bottom, you realize that overall it is an uptrending. When you look again, there are phases that are corrective.
Do a math yourself you check out the correction, the percentage of correction? You may find some clue of each correction.
Now remember, in finance market any policy will not just change, many of the policy will stay for a few months or years. In other worth, when the market trend, it will not just reverse. But the finance market will have the so called correction. Or we call it pull back or retracement.
H M Gartley in May 1935 published a 446 pages book title Profits in the Stock Market discussed a chart pattern is now know as a reversal strategy, Gartley 222 Reversal Chart pattern.
Always wait for the chart pattern to complete, for example wait for three candlestick to complete a mountain or valley be for connection the top or bottom. So, the current chart bearish candlestick has not done yet. The divergence drawn is premature, be aware.
A note, the Asia market is bearish today, bearish is not bad for some traders. Please check out most of the key stock on August 12. There always new elements in the market to make life interesting.
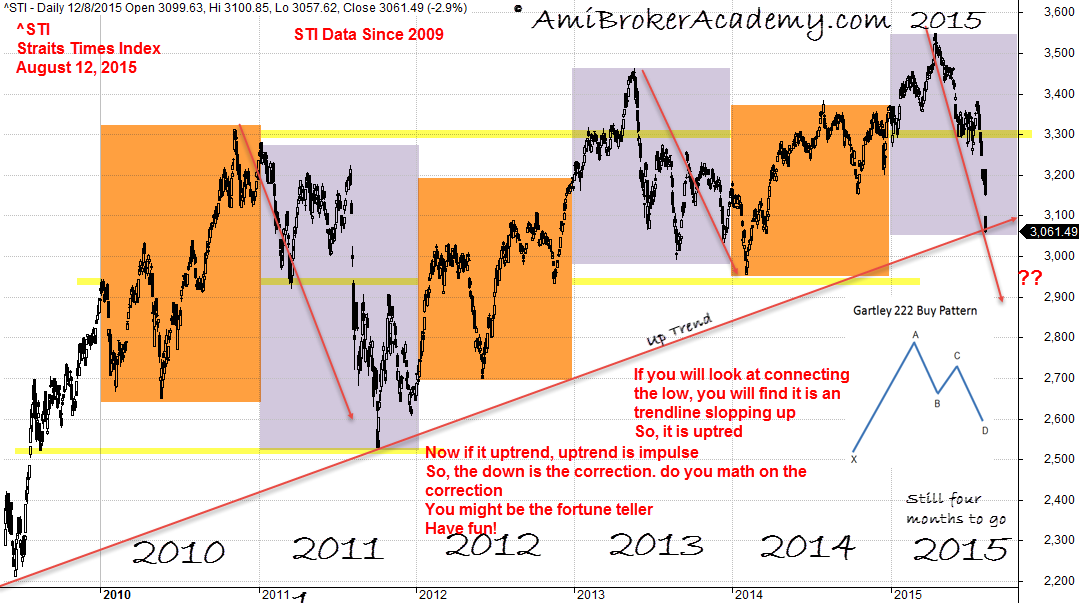
August 12, 2015 Straits Times Index Since 2010
When you get a hang of it, try this analysis on other index that you are interested. After that tell you friend your prediction. Soon you many become fortune teller. Hahaha.
Always draw lines on your chart and you many have more idea what next.
Thank you for visiting the website. Have fun!
Moses
DISCLAIMER
Website advice, “Stock trading is not a get rich quick scheme and it is high risk”.
Information provided here is of the nature of a general comment only and no intend to be specific for trading advice. It has prepared without regard to any particular investment objectives, financial situation or needs. Information should NOT be considered as an offer or enticement to buy, sell or trade.
You should seek advice from your broker, or licensed investment advisor, before taking any action.
The website does not guarantee any results or investment return based on the information and instruction you have read here. It should be used as learning aids.
THE CONTENTS HERE REFLECT THE AUTHOR’S VIEWS ACQUIRED THROUGH HIS EXPERIENCE ON THE TOPIC. THE AUTHOR OR WEBSITE DISCLAIMS ANY LOSS OR LIABILITY CAUSED BY THE UTILIZATION OF ANY INFORMATION PRESENTED HEREIN.
BESIDES THAT THE SOURCES MENTIONED HEREIN ARE ASSUMED TO BE RELIABLE AT THE TIME OF WRITING, THE AUTHOR AND WEBSITE ARE NOT RESPONSIBLE FOR THEIR ACCURACY AND ACTIVITIES.
THE CONTENT ONLY SHOULD BE CONSIDERED SOLELY FOR BASIC INFORMATION.
COPYRIGHT © 2015 Moses @ AmiBrokerAcademy.com. ALL RIGHTS RESERVED.
NO PART OF THE CONTENT MAY BE ALTERED, COPIED, OR DISTRIBUTED, WITHOUT PRIOR WRITTEN PERMISSION OF THE AUTHOR OR SITE.
ALL PRODUCT NAMES, LOGOS, AND TRADEMARKS ARE PROPERTY OF THEIR RESPECTIVE OWNERS WHO HAVE NOT NECESSARILY ENDORSED, SPONSORED, REVIEWED OR APPROVED THIS PUBLICATION.