January 25, 2015
Straits Times Index, STI Singapore Stocks Market benchmark.
The AB = CD pattern is one of the simplest to identify in any market, any timeframe, and is the basis of other patterns. The AB = CD pattern is a leading indicator that provide an approximate point where and when to enter and exit a trade. The AB = CD provides a visual, geometric price or time pattern comprised of three consecutive price swings; AB, BC, and CD.
This can be depicting in the following chart.
About ten days ago, we will still wonder can STI break the 3370 points. Finally, STI has crossed the 3370 points level. It is a very important level for STI. Can STI hold up this level? Will see.
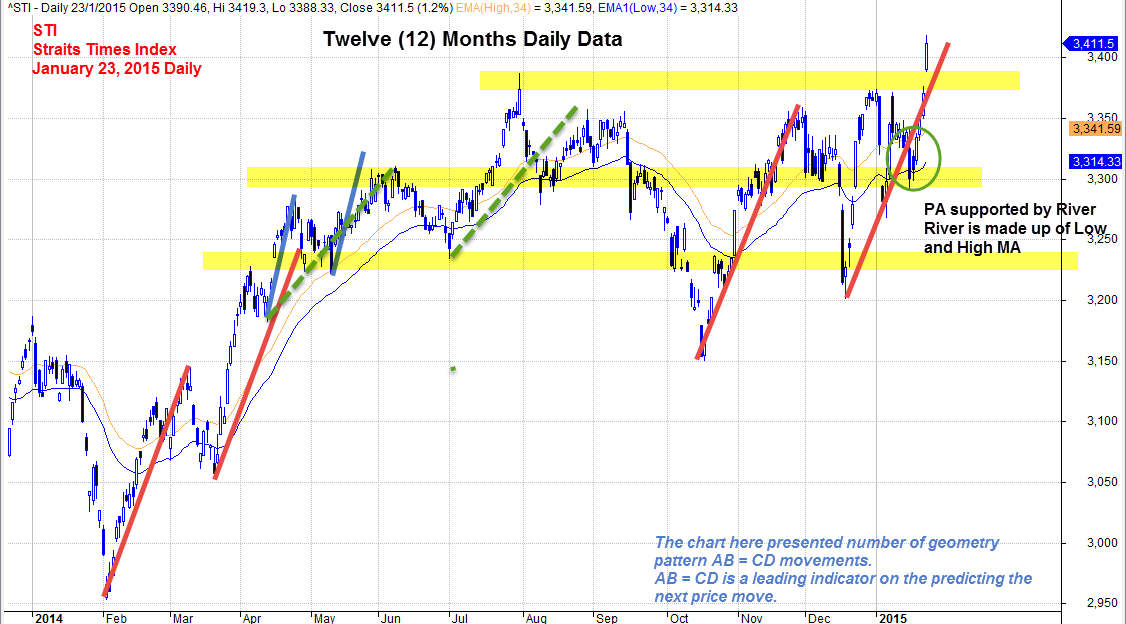
Straits Times Index, STI January 23, 2015 Daily
Thanks for visiting this extra ordinary site, AmiBrokerAcademy.com.
Watch this space here, some great stock will be analyse here. See you more.
Moses
DISCLAIMER
Stock trading is not a get rich quick scheme and it is high risk.
Information provided here is of the nature of a general comment only and no intend to be specific for trading advice. It has prepared without regard to any particular investment objectives, financial situation or needs. Information should NOT be considered as an offer or enticement to buy, sell or trade.
You should seek advice from your broker, or licensed investment advisor, before taking any action.
Once again, the website does not guarantee any results or investment return based on the information and instruction you have read here. It should be used as learning aids.
Trading is personal. You are responsible for your own trading decision.
The comment is the author personal experience. There is no intent for your believe and follow.