Welcome to Moses’ Stock Analysis and Review Column
Straits Times Index – A windows into Singapore economy
Market has two possibilities, either bullish or bearish. A window into Singapore economy, Straits Times Index, STI may form a bearish Head and Shoulders chart pattern (we have covered earlier, see the earlier posting for charts) or bullish flag (more charts to come). Picture (chart) worth a thousand words, you should have formed your opinion or view when you eyeball the chart. Aside of what the economist has predicted earlier, the true is out – Straits Times Index, although this is only the thirty stocks being picked to represent the market.
Let’s look back on Straits Times Index, STI from July 1 to July 4.
On Tuesday, July 1, Straits Times Index ended even more weaker and closed at 3242.64 points, STI drift further south for 13.03 points from the last closed at 3255.67 points.
On Wednesday, July 2, Straits Times Index closes stronger than the last closed at 3263.91 points. STI jumps 21.27 points higher from last closed at 3242.64 points.
It’s very encouraging, on Thursday, July 3, Straits Times Index closes even more higher, STI ended at 3273.15 points. However, it has weaker, only 9.24 points higher than the last closed at 3263.91 points.
On Friday, July 4, the bulls try hard to continue the momentum to drive north. However, Straits Times Index closed at 3272.25 points, ending weak. STI closed 0.9 points lower from the last closed at 3273.15 points.
Over all, the whole week performance was still positive, as market confidence has returned. Will see? Eyeball the chart, is it forming the right shoulder? Wait till the pattern is completed, otherwise it may be just a fail Head and Shoulders Chart pattern.
Chart tells (worth) a thousand words, see the chart for details.
July 1, 2014 Straits Times Index, STI Daily Chart
Head and Shoulders? Forming a bearish Head and Shoulders chart pattern. Only left shoulder is completed and breaking the neckline.
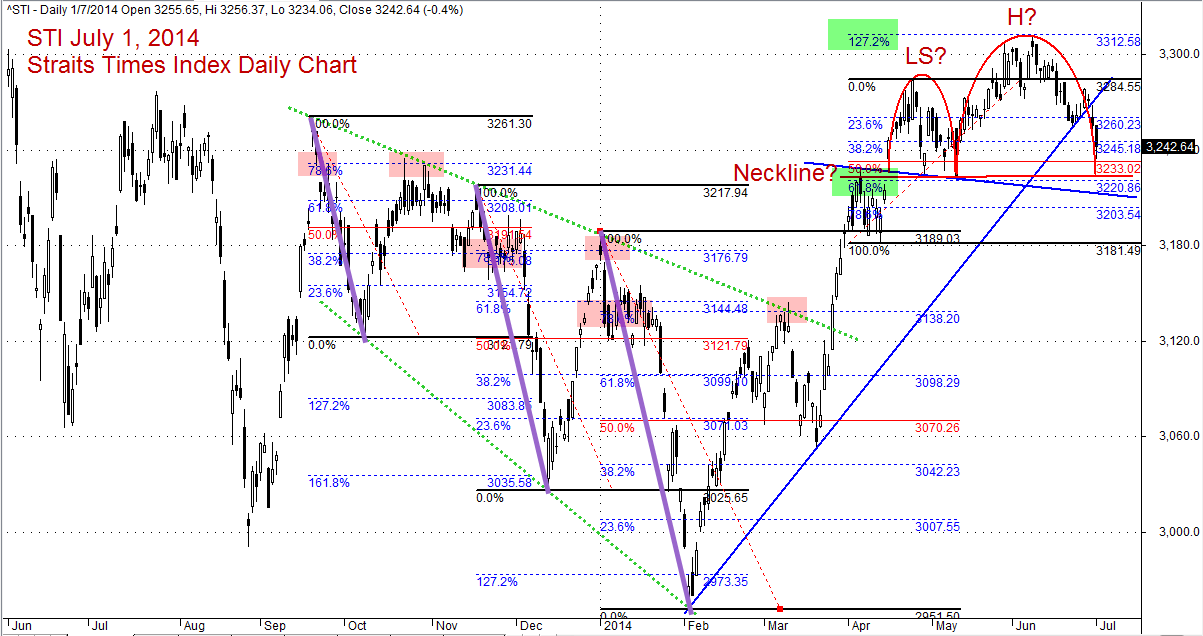
Singapore Stock Benchmark, Straits Times Index, STI July 1, 2014 Daily Chart
July 2, 2014 Straits Times Index, STI Daily Chart
A close up view of the STI.
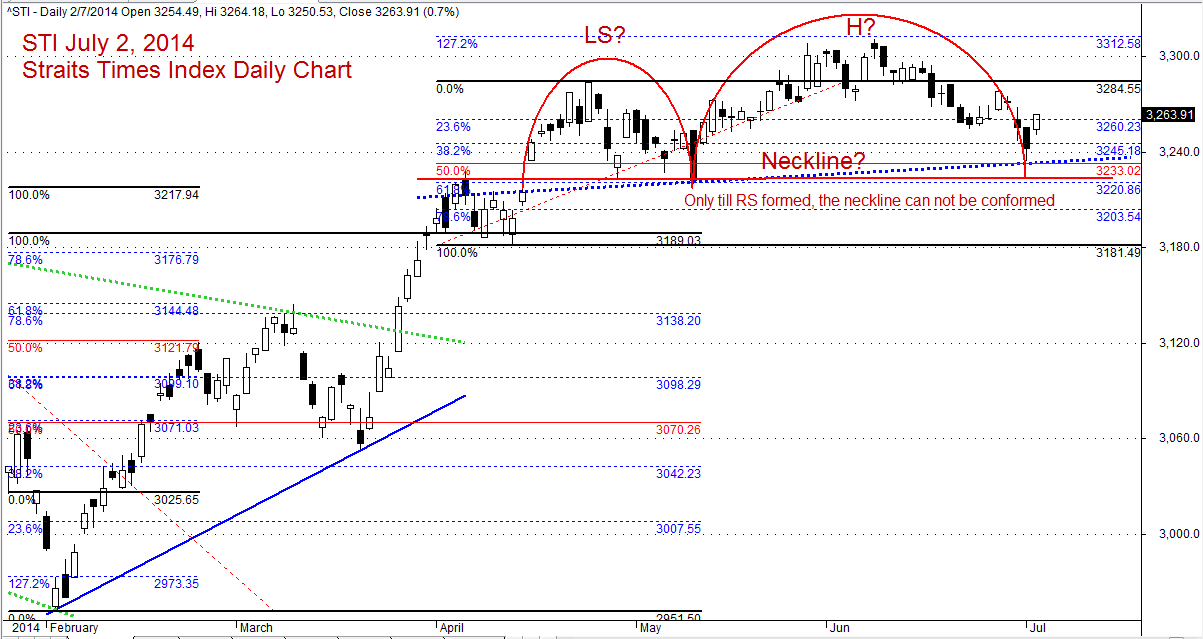
Straits Times Index, STI July 2, 2014 Daily Chart
.
July 4, 2014 Straits Times Index, STI Daily Chart
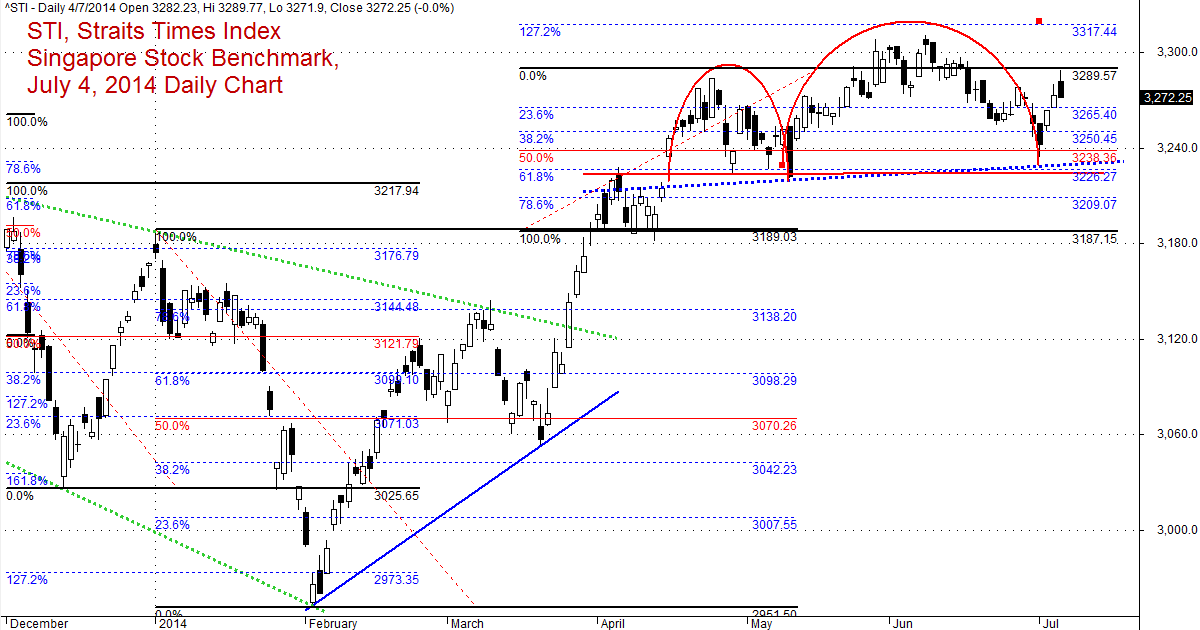
Straits Times Index, STI July 4, 2014 Daily Chart
.
Thanks for visiting the site, AmiBrokerAcademy.com.
Moses
DISCLAIMER
Information provided here is of the nature of a general comment only and no intend to be specific for trading advice. It has prepared without regard to any particular investment objectives, financial situation or needs. Information should not be considered as an offer or enticement to buy, sell or trade.
You should seek advice from your broker, or licensed investment advisor, before taking any action.
Once again, the website does not guarantee any results or investment return based on the information and instruction you have read here. It should be used as learning aids only and if you decide to trade real money, all trading decision should be your own.