June 2, 2014
Moses’s Stock Analysis, World Cup Spell and Elliott Wave
“… Markets also suffer around World Cup time, …” Noted by Dario Perkins, an economist at Lombard Street Research. Will the World Cup spell continue for 2014. Will see.
Recount the history, was it just a coincident or for real. “… in 1930, the first full year of the Great Depression. More recently, it coincided with the U.S. recession in 1990, a bond market crash that started in the U.S. and spread across developed markets in 1994, the Asian Financial Crisis and collapse of Connecticut-based hedge fund Long Term Capital Management (LTCM) in 1998, a U.S. housing market crash in 2006 and the beginning of the euro zone crisis in 2010. …
See the last post on stock benchmark, Straits Times Index, STI May 30, 2014. STI looks like is completing fifth waves, followed by reversal A, B, and C phases in a typical Elliott Wave pattern, see illustration. The reversal phases might be coincided with the World Cup. Watch your trade.
Typical Elliott Wave, developed by Ralph Nelson Elliott in August 1938
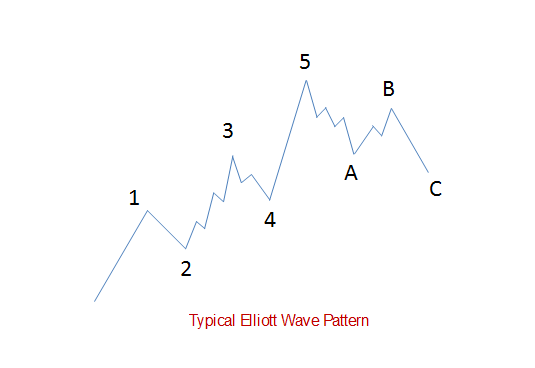
Typical Elliott Wave Pattern Illustration
.
Welcome to Moses’ Stock Review and Free MACD Stock Scanner. In the month of May, 2014 the stock benchmark has a rally of 86.37 points; low 3222.43 points and high 3308.80 points. On the hold, STI has travelled north. STI is on the raise and on the fifth wave.
Today, June 2, 2014 market closed at 3302.24 points, STI, stock benchmark rally another 6.39 points from the last closed at 3295.85 points. But, hit a Doji; the traders are indecision.
June 2, 2014 Straits Times Index, STI Daily Chart
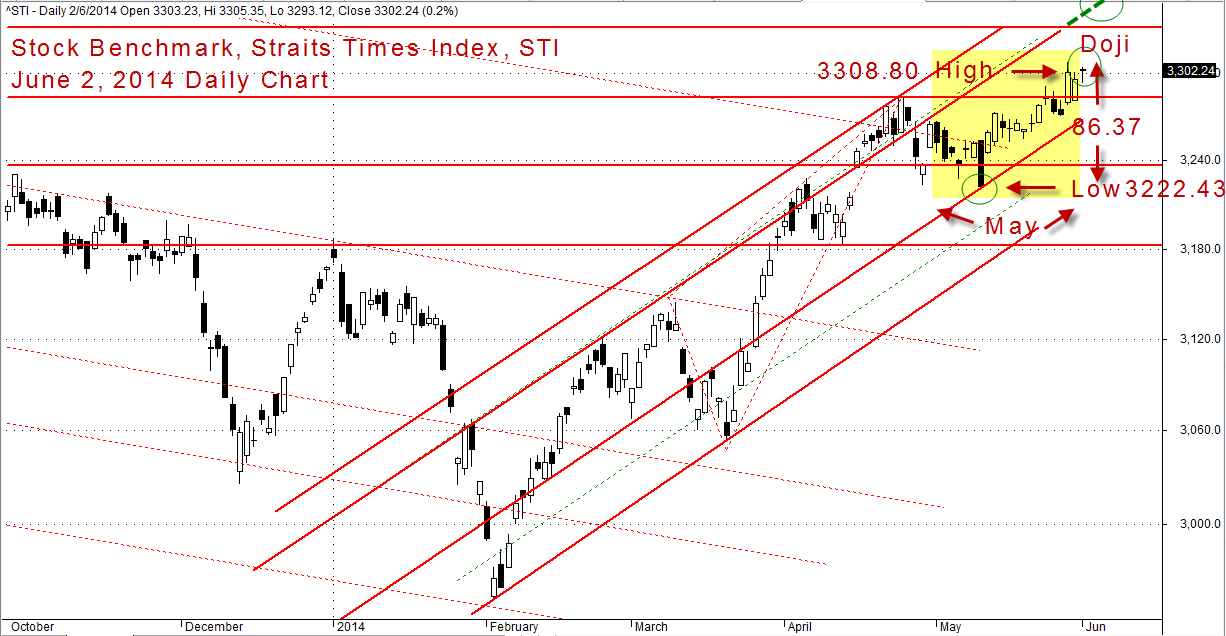
Stock Benchmark, Straits Times Index, STI June 2, 2014 Daily Chart
.
June 2, 2014 Moses Free Stock MACD Scan Results
Free stock market scan results, Moses’ Stock Corner. Moses provides a list of Singapore stocks that have the following MACD signals.
- MACD line crosses above MACD signal – Bullish trend
- MACD line crosses above zero line – Bullish trend
- MACD Histogram +ve Divergence – Bullish trend
- MACD line crosses below MACD signal – Bearish trend
- MACD line crosses below zero line – Bearish trend
- MACD Histogram -ve Divergence – Bearish trend
- Volume traded greater 500,000 shares
June 2, 2014 Total 57 stocks have MACD bullish and bearish signals, 26 stocks are traded more than 500,000 shares.
| Ticker | Company | Signals | Close | Vol.(K) | Screening Result |
| 5G2 | KIMHENG OFFSHORE&MARINE HLDLTD | Bullish | 0.255 | 6132 | MACD Cross-Up ZeroLine |
| M1Z | TEE INTERNATIONAL LIMITED | Bullish | 0.29 | 2090 | MACD Cross-Up ZeroLine |
| 583 | PROGEN HOLDINGS LTD | Bullish | 0.163 | 1680 | MACD Cross-Up Signal |
| J85 | CDL HOSPITALITY TRUSTS | Bullish | 1.745 | 1467 | MACD Cross-Up ZeroLine |
| U11 | UNITED OVERSEAS BANK LTD | Bullish | 22.7 | 1369 | MACD Cross-Up Signal |
| U96 | SEMBCORP INDUSTRIES LTD | Bullish | 5.45 | 1157 | MACD Cross-Up ZeroLine |
| U19 | UNITED ENVIROTECH LTD | Bullish | 1.3 | 964 | MACD Cross-Up ZeroLine |
| N9LU | PERENNIAL CHINA RETAIL TRUST | Bullish | 0.545 | 880 | MACD Cross-Up ZeroLine |
| B73 | GLOBAL INVESTMENTS LIMITED | Bullish | 0.148 | 610 | MACD Cross-Up Signal |
| L19 | LUM CHANG HOLDINGS LIMITED | Bullish | 0.375 | 606 | MACD Cross-Up Signal |
| E5H | GOLDEN AGRI-RESOURCES LTD | Bearish | 0.57 | 26322 | MACD Cross-Down Signal |
| P13 | PENGUIN INTERNATIONAL LIMITED | Bearish | 0.23 | 12479 | MACD Cross-Down Signal |
| A17U | ASCENDAS REAL ESTATE INV TRUST | Bearish | 2.41 | 10874 | MACD -ve Divergence |
| 5UO | SYSMA HOLDINGS LIMITED | Bearish | 0.255 | 9784 | MACD Cross-Down Signal |
| S24 | STATS CHIPPAC LTD | Bearish | 0.49 | 8936 | MACD Cross-Down Signal |
| 5ME | EZION HOLDINGS LIMITED | Bearish | 2.17 | 7112 | MACD Cross-Down Signal |
| C61U | CAPITACOMMERCIAL TRUST | Bearish | 1.66 | 6930 | MACD-H -ve Divergence |
| B20 | BIOSENSORS INT’L GROUP LTD. | Bearish | 0.95 | 3250 | MACD Cross-Down ZeroLine |
| 542 | GIKEN SAKATA (S) LIMITED | Bearish | 0.365 | 3174 | MACD -ve Divergence |
| 566 | SEE HUP SENG LIMITED | Bearish | 0.295 | 2952 | MACD Cross-Down Signal |
| B9S | COSMOSTEEL HOLDINGS LIMITED | Bearish | 0.465 | 2256 | MACD Cross-Down Signal |
| K71U | KEPPEL REIT | Bearish | 1.3 | 2216 | MACD-H -ve Divergence |
| ME8U | MAPLETREE INDUSTRIAL TRUST | Bearish | 1.445 | 2130 | MACD Cross-Down ZeroLine |
| 5G9 | TRITECH GROUP LIMITED | Bearish | 0.22 | 1531 | MACD Cross-Down Signal |
| OU8 | CENTURION CORPORATION LIMITED | Bearish | 0.725 | 627 | MACD Cross-Down ZeroLine |
| M04 | MANDARIN ORIENTAL INTL LTD | Bearish | 1.825 | 559 | MACD Cross-Down Signal |
Thanks for visiting the site.
Moses
DISCLAIMER
Information provided here is of the nature of a general comment only and no intend to be specific for trading advice. It has prepared without regard to any particular investment objectives, financial situation or needs. Information should not be considered as an offer or enticement to buy, sell or trade.
You should seek advice from your broker, or licensed investment advisor, before taking any action.
Once again, the website does not guarantee any results or investment return based on the information and instruction you have read here. It should be used as learning aids only and if you decide to trade real money, all trading decision should be your own.