May 11, 2018
Thanks for visiting the site, AmiBrokerAcademy.com.
Singapore Stock Analysis – Chart Stories
5CF OKP Holdings and MACD
Study OKP Holdings stock price using MACD. MACD is a leading trend change indicator, picture worth a thousand words, see chart for more. Manage your risk.
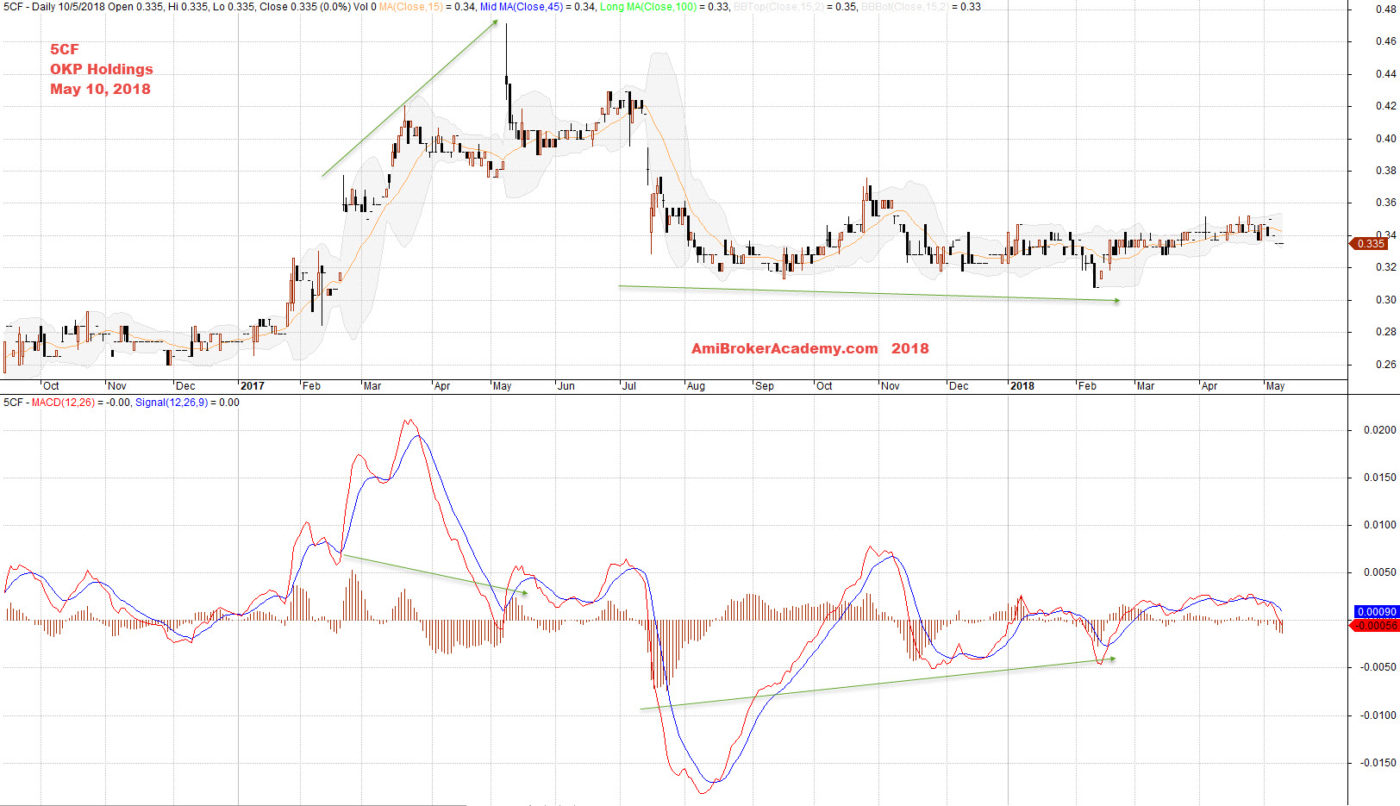
May 10, 2018 OKP Holdings and MACD
5CF OKP Holdings and Trade Strategy
Study OKP Holdings stock price using simple trading strategy and approach such as H M Gartley ABCD pattern. Besides that ABCD can help to find great entry and exit. But all set up can fail. Remember to add the support resistance, it is always true for buy support and sell resistance. Manage your risk trade with eyes open.
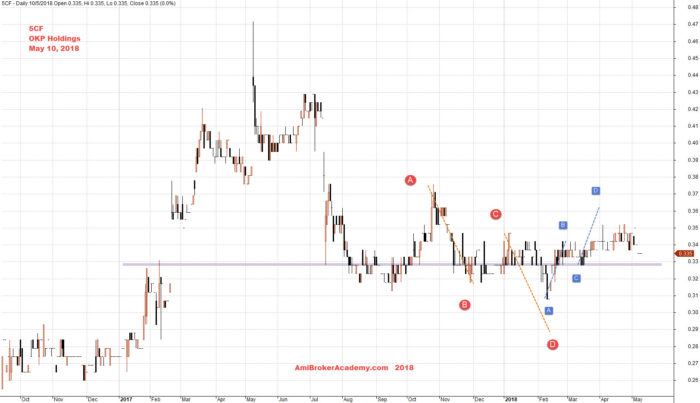
May 10, 2018 OKP Holdings Charting
5CF OKP Holdings and MA Wave
Picture worth a thousand words, see chart. The price zip up and down of the MA. Besides that the price action getting “smaller”. Manage your risk.
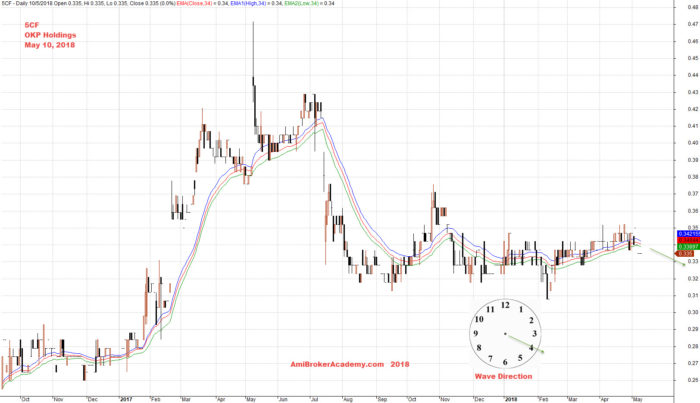
May 10, 2018 OKP Holdings and MA Wave
Moses Stock Analysis
AmiBrokerAcademy.com
Disclaimer: All information, data and material contained, presented, or provided on amibrokeracademy.com is for educational purposes only. It is not to be construed or intended as providing trading or legal advice. Decisions you make about your trading or investment are important to you and your family, therefore should be made in consultation with a competent financial advisor or professional. We are not financial advisor and do not claim to be. Any views expressed here-in are not necessarily those held by amibrokeracademy.com. You are responsible for your trade decision and wealth being.