STI scan, Singapore stocks market benchmark, Straits Times Index gaps up this morning (December 1), above 20 days EMA at 2769.19 points. The index get push to the high of 2779.66 points but the bear slip in to drive in low to 2766.69 points. What will happen next? This is just the first hour after the market open. Is this driven by the rallies around the world? Two things a trader will do, 1) is your entry supported by your own analysis? 2) can you afford the risk? When both answers are yes, take the trade.
On November 30, STI scan, STI closed at 2702.46 points. It is 14.36 points up compared the previous day low. The market was open at 2700.54 points, but the bear drove it down to 2677.66 points. The market is very caution to make their trade decision.
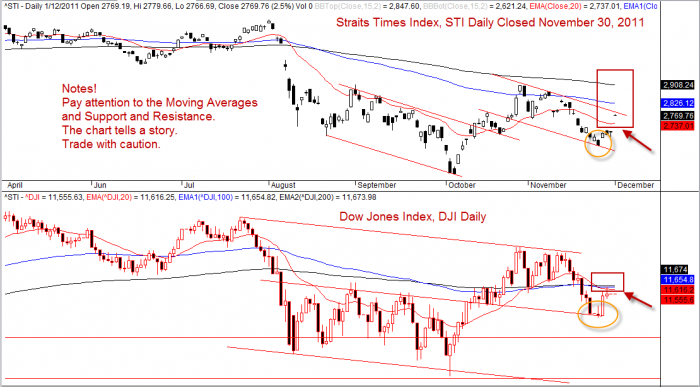
The daily chart of Straits Times Index, STI has shown support for MACD signal. The Relative Strength Index, RSI is pointing up and above 30. Can STI continue to be strengthening as many think it will return to 2900? Trade what you see and not what you think! This was one of the great advice from a successful trader.
See the comment in the chart.

See the chart that compare STI and Dow Jones Index, DJI and draw some correlation. The trend will remain correct till is validated.
Disclaimer
The above result is for illustration purpose. It is not meant to be used for buy or sell decision. We do not recommend any particular stocks. If particular stocks or indices of such are mentioned, they are meant as demonstration of Amibroker as a powerful charting software. Example, it can insert another price or index such as Dow Jones Index, DJI to compare with the stocks or index you are studying.
Once again, the website does not guarantee any results or investment return based on the information and instruction you have read here. Please get your advice from the professional financial consultant.