It is good to relook at the chart and looking for the new meaning. After the week close, we can confirm the bearish candlestick; index close below the opening. We see the index has rejected by the same high, for continuous in two weeks.
We saw ^STI was weak last week. Reading the chart bar by bar and we now confirm the index is weak.
We see an inverted head and shoulders. But the index has rejected at the right shoulder after breakout the neckline. Is it a bull trap? Will see.
Picture worth a thousand words. See chart for more.
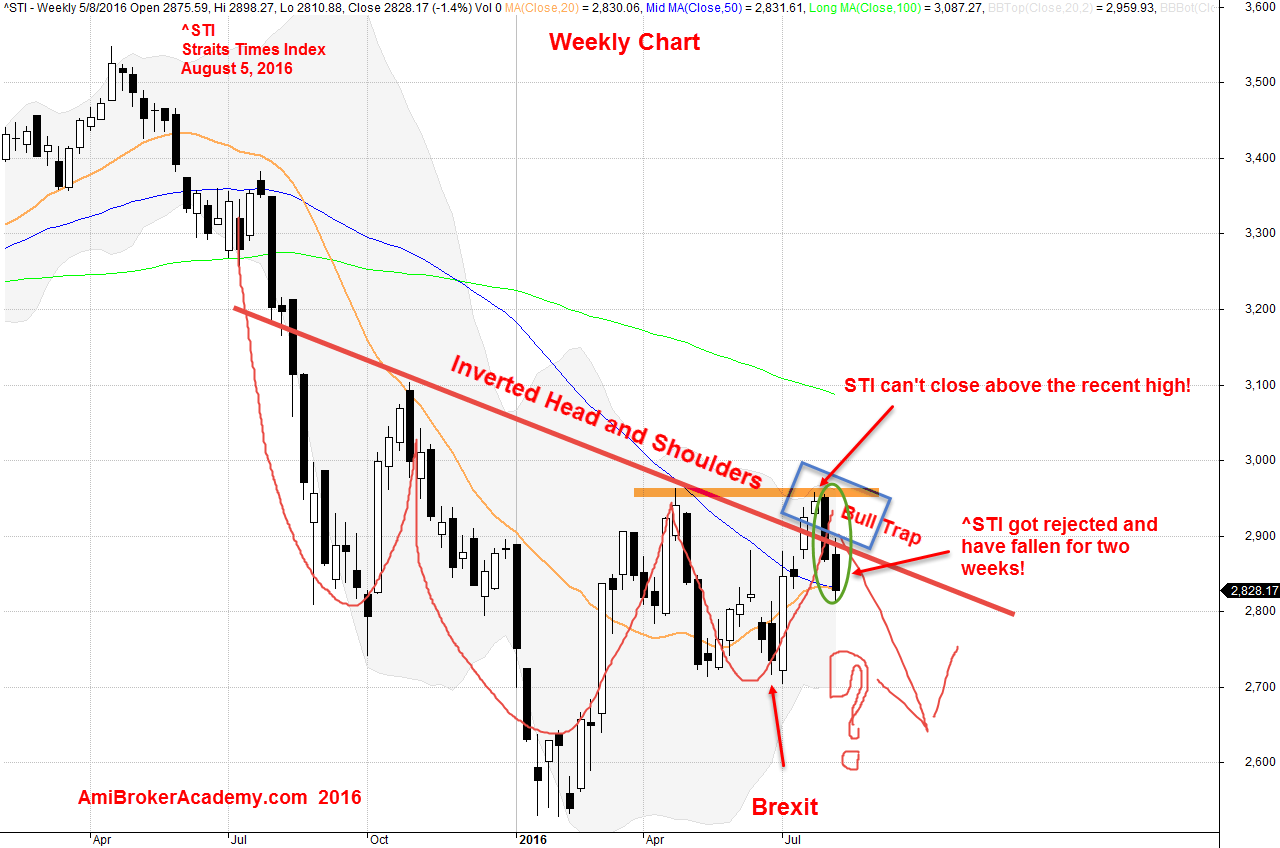
August 5, 2016 Straits Times Index, ^STI weekly chart
Moses Stock Analysis and Scan
AmiBrokerAcademy.com
Disclaimer: All information, data and material contained, presented, or provided on amibrokeracademy.com is for educational purposes only. It is not to be construed or intended as providing trading or legal advice. Decisions you make about your trading or investment are important to you and your family, therefore should be made in consultation with a competent financial advisor or professional. We are not financial advisor and do not claim to be. Any views expressed here-in are not necessarily those held by amibrokeracademy.com. You are responsible for your trade decision and wealth being.