April 9, 2014 Singapore Stocks Scan
Moses’s Stocks Corner at amibrokeracademy.com.
Trendlines
How to Draw Trendlines?
You may be wonder, this the most basic stuff in technical analysis. However, how many of you have got it right. Quite often you see people draw a trendline connecting the last bar either top or bottom. Wrong! This is wrong, until the swing shows the peak or trough you cannot connect it as part of the drawn trendline.
How many bar should I wait?
Three, just three bars, three bars are enough to confirm whether it is peak or trough. Of course some may call it mountain or valley. So never connect the last bar for your trendline, but the last second bar. Otherwise you may make a major wrong decision for your trade. Unless you are so lucky, because your trendline reference was wrong.
Trendline, a correct trendline has to connect two or more peaks (mountains) or troughs (valleys).
So, only you can draw a proper trendline for your price and oscillator, you cannot decide whether there is a bullish or bearish divergence. And again until you can confirm the price turning, the divergence is just an indicator tells you that there is a possible price turning. Indicator is just like traffic light, it signals you that you may have to stop, but the light may continue to stay green.
Breakout
This is true for price breakout too. Unless the price continue for another bar at least for the same direction. The breakout can turn into whipsaw. In other words (meaning of whipsaw), after the price breakout, the price change direction in the next bar. Whipsaw in financial term is an abrupt surge in change of price direction.
Have fun! Please trade with eyes open.
Singapore Stock Market Straits Times Index, STI
The Singapore Stock Market benchmark, Straits Times Index, STI today closed at 3209.92 points 5.83 points higher than the last closed 3204.09 points. The index, STI retests the 3200 resistance and the index has breakout. The project will always be true till the final outcome. The Index projected to climb and heading north.
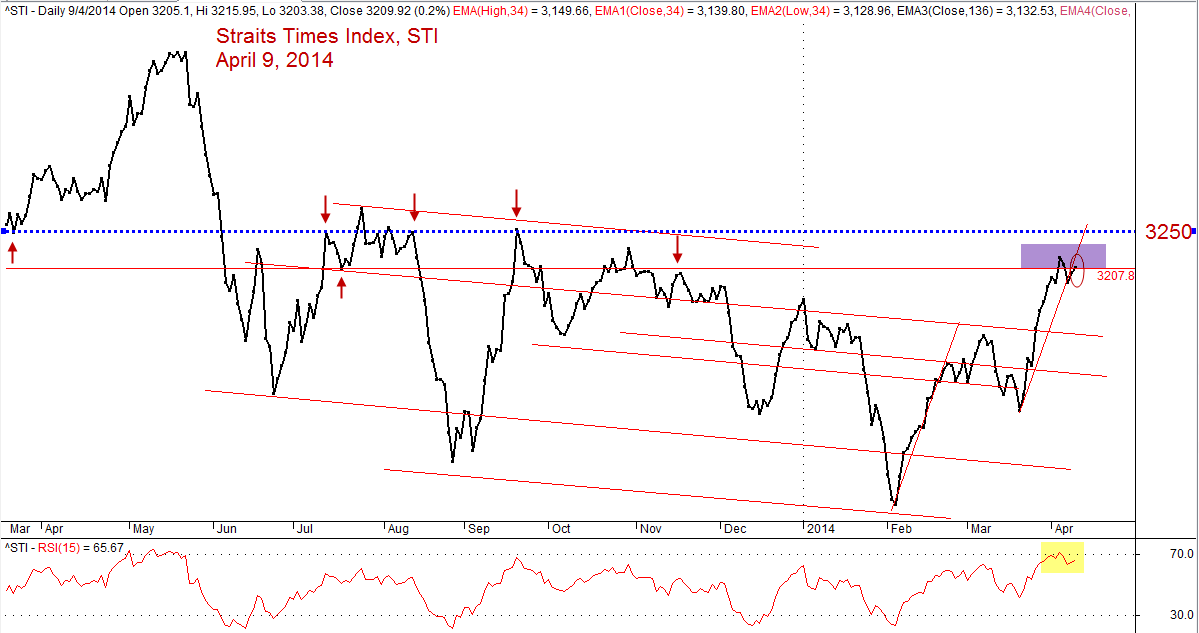
STI, Straits Times Index April 9, 2014. Closed 3209.92.
MACD Scan Results
The following are April 9, 2014 Singapore stocks scan results that have MACD bullish or bearish signal. Total 74 stocks have MACD bullish or bearish signal. Out of 74 stocks, 40 stocks have bullish signal and 34 stocks have bearish signal. Only 29 stocks have volume greater than 500K. The following are the 29 stocks.
| Ticker | Company | Bullish/Bearish | Close | Vol.(K) | Screening Result | |
| 1 | E5H | GOLDEN AGRI-RESOURCES LTD | Bullish | 0.61 | 127082 | MACD Cross-Up Signal |
| 2 | JS8 | CAPITAMALLS ASIA LIMITED | Bullish | 1.76 | 10054 | MACD Cross-Up ZeroLine |
| 3 | G4F | OTTO MARINE LIMITED | Bullish | 0.079 | 9969 | MACD-H +ve Divergence |
| 4 | 584 | OEL (HOLDINGS) LIMITED | Bullish | 0.076 | 5973 | MACD-H +ve Divergence |
| 5 | 5DN | EZRA HOLDINGS LIMITED | Bullish | 1.09 | 5196 | MACD Cross-Up ZeroLine |
| 6 | 5GI | INTERRA RESOURCES LIMITED | Bullish | 0.395 | 2824 | MACD Cross-Up Signal |
| 7 | 5WH | REX INTERNATIONAL HOLDING LTD | Bullish | 0.585 | 2636 | MACD-H +ve Divergence |
| 8 | 557 | VIKING OFFSHORE AND MARINE LTD | Bullish | 0.131 | 2057 | MACD +ve Divergence |
| 9 | S69 | SERIAL SYSTEM LTD | Bullish | 0.14 | 2027 | MACD Cross-Up Signal |
| 10 | D79 | C&G ENV PROTECT HLDGS LTD | Bullish | 0.28 | 1921 | MACD Cross-Up ZeroLine |
| 11 | 5DE | EMS ENERGY LIMITED | Bullish | 0.062 | 1869 | MACD Cross-Up Signal |
| 12 | A53 | A-SONIC AEROSPACE LIMITED | Bullish | 0.104 | 1557 | MACD Cross-Up Signal |
| 13 | G18 | GRP LTD | Bullish | 0.107 | 1408 | MACD Cross-Up Signal |
| 14 | 5IE | LORENZO INTERNATIONAL LIMITED | Bullish | 0.07 | 843 | MACD Cross-Up Signal |
| 15 | Y07 | GLOBAL YELLOW PAGES LIMITED | Bullish | 0.083 | 749 | MACD +ve Divergence |
| 16 | 5QT | CHARISMA ENERGY SERVICES LTD | Bearish | 0.058 | 156825 | MACD Cross-Down Signal |
| 17 | 5H0 | SINGHAIYI GROUP LTD. | Bearish | 0.167 | 6941 | MACD Cross-Down Signal |
| 18 | T09 | TT INTERNATIONAL LIMITED | Bearish | 0.173 | 6510 | MACD Cross-Down Signal |
| 19 | F01 | VIBRANT GROUP LIMITED | Bearish | 0.103 | 5693 | MACD Cross-Down Signal |
| 20 | O2F | SWING MEDIA TECHNOLOGY GRP LTD | Bearish | 0.063 | 2660 | MACD Cross-Down Signal |
| 21 | 594 | LOYZ ENERGY LIMITED | Bearish | 0.355 | 2068 | MACD Cross-Down Signal |
| 22 | J10 | JAYA HOLDINGS LTD | Bearish | 0.775 | 1867 | MACD Cross-Down Signal |
| 23 | I03 | INFORMATICS EDUCATION LTD. | Bearish | 0.087 | 1613 | MACD Cross-Down Signal |
| 24 | C14 | CWT LIMITED | Bearish | 1.51 | 1343 | MACD Cross-Down Signal |
| 25 | O08 | OSSIA INTERNATIONAL LTD | Bearish | 0.325 | 1063 | MACD Cross-Down Signal |
| 26 | L28 | LONGCHEER HOLDINGS LIMITED | Bearish | 0.31 | 887 | MACD Cross-Down Signal |
| 27 | T8V | PACIFIC RADIANCE LTD. | Bearish | 1.095 | 825 | MACD Cross-Down Signal |
| 28 | B2F | M1 LIMITED | Bearish | 3.44 | 768 | MACD Cross-Down Signal |
| 29 | NO4 | DYNA-MAC HOLDINGS LTD. | Bearish | 0.39 | 530 | MACD-H -ve Divergence |
Wow! Golden Agri had the largest volume 127,082 K with MACD Cross Up Signal.
Moses
DISCLAIMER
Information provided here is of the nature of a general comment only and no intend to be specific for trading advice. It has prepared without regard to any particular investment objectives, financial situation or needs. Information should not be considered as an offer or enticement to buy, sell or trade.
You should seek advice from your broker, or licensed investment advisor, before taking any action.
Once again, the website does not guarantee any results or investment return based on the information and instruction you have read here. It should be used as learning aids only and if you decide to trade real money, all trading decision should be your own.