Welcome to AmiBroker Academy.com.
Trading is no absolute bullish or bearish, the price action reflect the market emotions.
Straits Times Index Analysis
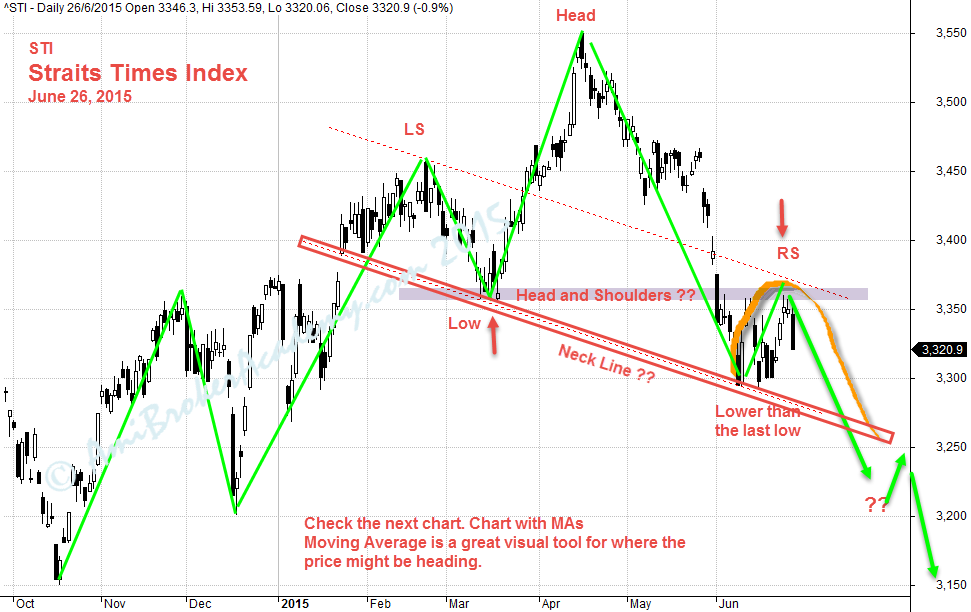
Chart worth a thousand words, we see a possible Head and Shoulder chart pattern, a bearish chart pattern. The chart pattern is still in progress. The right shoulder is lower than the left shoulders. The right shoulder is resisted by left shoulder support. …
June 26, 2015 Straits Times Index, STI
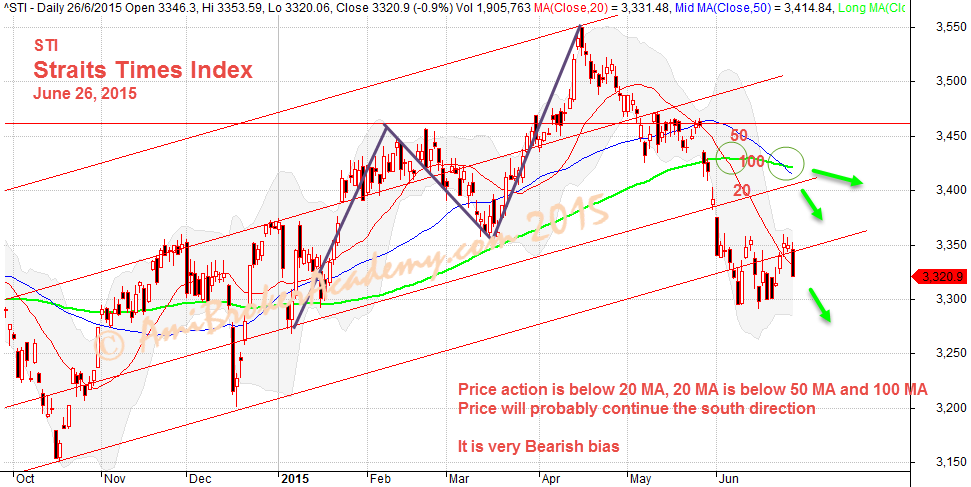
Price Below 20 MA, 20 MA below 50 and 100 MA
From the chart, price action is bearish bias.
Chart worth a thousand words, 20 MA is 5 o’clock, 50 MA is 5 o’clock, 100 MA is 4 o’clock. We can clearly see the ABCD sell chart pattern.
June 26, 2015 Straits Times Index
You can read about other US Stocks analysis and scan in this website.
Thanks for visiting the website.
Moses
DISCLAIMER
Site advice, “Stock trading is not a get rich quick scheme and it is high risk”.
Information provided here is of the nature of a general comment only and no intend to be specific for trading advice. It has prepared without regard to any particular investment objectives, financial situation or needs. Information should NOT be considered as an offer or enticement to buy, sell or trade.
You should seek advice from your broker, or licensed investment advisor, before taking any action.
The website does not guarantee any results or investment return based on the information and instruction you have read here. It should be used as learning aids.