Singapore Stocks Market Daily Scan
Using MACD Scanner, the MACD scanner has picked 19 stocks at December 8, 2011 closed that passed the scan criteria. We only consider volume exceeding 100K and price closed above $1. Out of 19 stocks picked only 5 stocks were bullish, and the rest of 14 stocks were bearish. The Straits Times shares market benchmark, Straits Times Index, STI is closed 54.24 points lower than last closed.
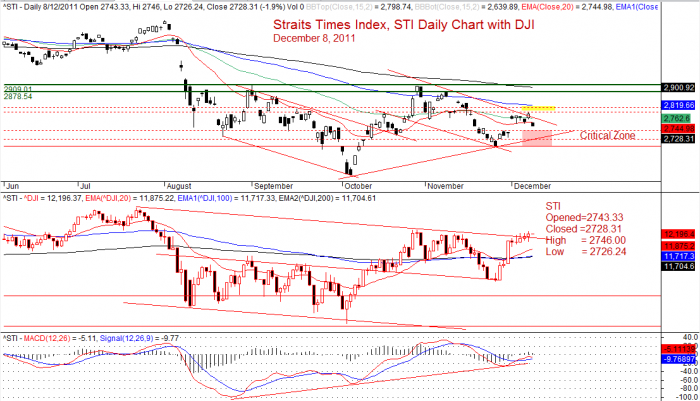
Straits Times Index
O (open) = 2743.33 points
C (close) = 2728.31 points
H (high) = 2746.00 points
L (low) = 2726.24 points
Previous day closed 2782.55 points
STI is at the critical resistance zone,
The following are the 19 Stocks Pick from MACD Scanner
| Company | Type | Close | Vol.(K) | Screening Result |
| CAPITALAND LIMITED | bearish |
2.42 |
44695 |
MACD Cross-Down Signal |
| SINGTEL | bullish |
3.14 |
23200 |
MACD Cross-Up ZeroLine |
| ASCENDAS REAL ESTATE INV TRUST | bearish |
1.92 |
13425 |
MACD Cross-Down Signal |
| CAPITAMALL TRUST | bearish |
1.725 |
10114 |
MACD Cross-Down Signal |
| WING TAI HLDGS LTD | bearish |
1 |
7543 |
MACD Cross-Down Signal |
| CITY DEVELOPMENTS LIMITED | bearish |
9.18 |
6260 |
MACD Cross-Down Signal |
| SINGAPORE PRESS HLDGS LTD | bearish |
3.7 |
5245 |
MACD Cross-Down Signal |
| CAPITACOMMERCIAL TRUST | bearish |
1.08 |
4985 |
MACD Cross-Down ZeroLine |
| FRASER AND NEAVE LIMITED | bearish |
6.06 |
4195 |
MACD Cross-Down Signal |
| OSIM INTERNATIONAL LTD | bullish |
1.08 |
1724 |
MACD Cross-Up ZeroLine |
| HO BEE INVESTMENT LIMITED | bearish |
1.14 |
1664 |
MACD Cross-Down Signal |
| CDL HOSPITALITY TRUSTS | bullish |
1.6 |
1560 |
MACD Cross-Up ZeroLine |
| SIA ENGINEERING CO LTD | bearish |
3.4 |
712 |
MACD Cross-Down Signal |
| SC GLOBAL DEVELOPMENTS LTD | bearish |
1.1 |
676 |
MACD Cross-Down Signal |
| PARKWAYLIFE REIT | bearish |
1.785 |
668 |
MACD Cross-Down Signal |
| JARDINE STRATEGIC HLDGS LTD | bullish |
30.24 |
317 |
MACD Cross-Up ZeroLine |
| JARDINE MATHESON HLDGS LTD | bullish |
50 |
206 |
MACD Cross-Up Signal |
| CAPITARETAIL CHINA TRUST | bearish |
1.14 |
194 |
MACD Cross-Down Signal |
| SUPER GROUP LTD. | bearish |
1.45 |
109 |
MACD Cross-Down Signal |
Straits Times Index, STI Daily Chart with Dow Jones Index, DJI
Disclaimer
The above result is for illustration purpose. It is not meant to be used for buy or sell decision. We do not recommend any particular stocks. If particular stocks of such are mentioned, they are meant as demonstration of Amibroker as a powerful charting software and MACD characteristics. Amibroker can program to scan the stocks for buy and sell signals.
These are script generated signals. Not all scan results are shown here. The MACD signal should use with price action. Users must understand what MACD and price action are all about before using them. If necessary you should attend a course to learn more on Technical Analysis (TA) and Moving Average Convergence Divergence, MACD.
Once again, the website does not guarantee any results or investment return based on the information and instruction you have read here.