Welcome!
Singapore stock scan provide you some Singapore stocks to monitor when you have no idea which stock to watch. Welcome to AmiBrokerAcademy.com free MACD Singapore stock scan. MACD stock scanner will run on a daily basis to help filter Singapore stock listing in Singapore Stock Exchange, SGX that show bullish trade signal or bearish trade signal.
The MACD scanner here will only identify stocks that have MACD bullish signal or bearish signal. The MACD scanner will only pick those stocks that have fulfilled the conditions of volume greater than 100K and have stock price more than a dollar.
Moving Average Convergence Divergence, MACD
For those we do not know what MACD is. MACD was developed by Gerald Appel in the late seventies.
- MACD stands for Moving Average Convergence Divergence, the MACD line (red line or called fast line) and MACD signal line (blue line, or called slow line).
- MACD Bullish Signal Line Cross: MACD bullish signal when red line crosses above the blue line or MACD line crosses above zero line.
- MACD Bearish Signal Line Cross: MACD bearish signal when blue line crosses below red line or MACD line crosses below zero line.
MACD Screening
These are 7 stocks picked for today. The following 7 stocks passed our selection criteria for MACD scan script that closed on January 9, 2012. These stocks are volume exceeding 100K and price above one dollar.
4 stocks are having bullish MACD signal and 3 are having bearish signal.
| Company | Type | Close | Vol.(K) | Screening Result |
| ASCENDAS REAL ESTATE INV TRUST | bullish |
1.94 |
3163 |
MACD Cross-Up ZeroLine |
| YANLORD LAND GROUP LIMITED | bullish |
1.01 |
2245 |
MACD Cross-Up ZeroLine |
| SATS LTD. | bullish |
2.26 |
741 |
MACD Cross-Up ZeroLine |
| CAPITARETAIL CHINA TRUST | bullish |
1.16 |
106 |
MACD Cross-Up ZeroLine |
| JARDINE CYCLE & CARRIAGE LTD | bearish |
49.42 |
133 |
MACD -ve Divergence |
| HONGKONG LAND HOLDINGS LIMITED | bearish |
4.83 |
1545 |
MACD-H -ve Divergence |
| UNITED OVERSEAS BANK LTD | bearish |
15.16 |
3898 |
MACD Cross-Down Signal |
Straits Times Index, Singapore stock market benchmark, STI for market ended January 9, 2012
O = 2696.81 points
C = 2691.28 points
H = 2707.53 points
L = 2683.15 points
Singapore stock market benchmark, Straits Times Index, STI closed at 2691.28 points, fail below the 2700 level. STI closed 24.31 points lower than the last closed. This ends the last week rally. .
There are many reasons or excuses given for the fall. Such as the uncertainty of the Eurozone debt crisis, the gloomy economy forecast, although the US employment rate is improving. At the end of the day, it is trader own emotion, psychology, and money management.
Straits Times Index Daily Chart, for market ended January 9, 2012
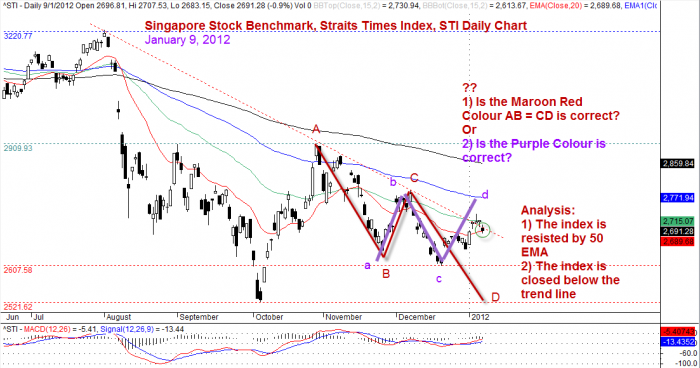
Straits Times Index Daily Chart, 9 January 2012, interesting AB = CD patterns
By Moses
DSICLAIMER
Information provided here is of the nature of a general comment only and no intend to be specific for trading advice. It has prepared without regard to any particular investment objectives, financial situation or needs. Information should not be considered as an offer or enticement to buy, sell or trade.
You should seek advice from your broker, or licensed investment advisor, before taking any action.
Once again, the website does not guarantee any results or investment return based on the information and instruction you have read here. It should be used as learning aids only and if you decide to trade real money, all trading decision should be your own.