Welcome to AmiBrokerAcademy.com website.
Have fun!
Hope you can see we are working very hard. To help you think and think and see more things. We use many chart to illustrate different view to show you some of the possibility. Remember, technical analysis and indicators are all probability.
Do you have an Ah-ha moment after reading the charts and comments?
Have fun!
SIA Engineering Co Stock Analysis
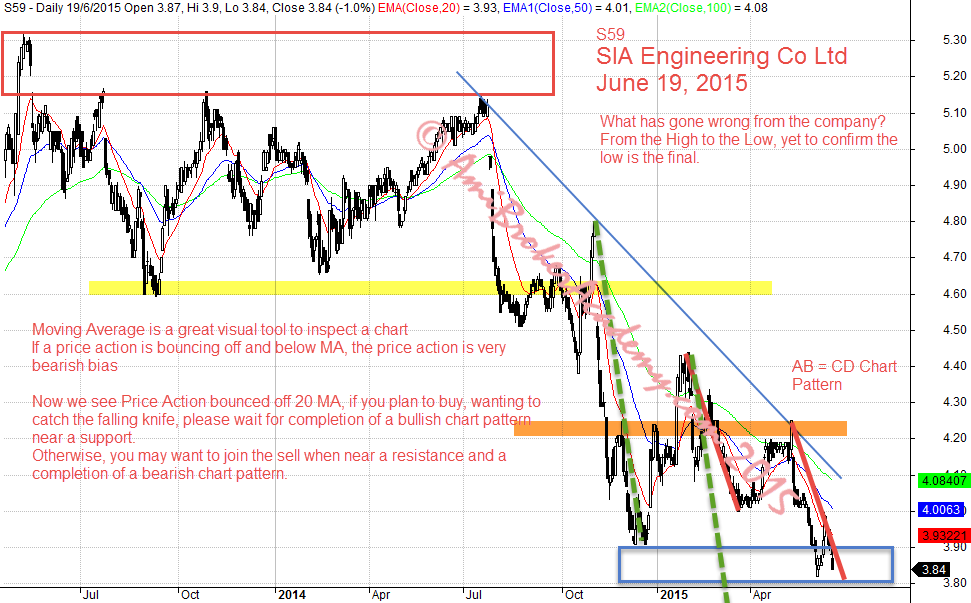
1) High Low of S59
Look left and think right, this is the basic technical analysis.
S59 has gone from the peak in May 2014 to the new low in June 2015. This not final yet. You can find many ABCD Chart pattern. Is this a Three Drive pattern? Why this stock has been falling since 2014? Although in TA we do not have emotion about the company, good company bad company, we use the same tool, same technique, and so to decide the buy or sell.
As we believe Moving Average is a great visual tool to inspect chart, we see the price is currently below MAs, such as 20 MA, 50 MA and 100 MA. The stock is very bearish bias at the moment. So be very careful in trading this stock.
June 19, 2015 SIA Engineering Co Ltd
2) Closed Up View of S59
The price Action has trapped between Equal Distance Channel. There are many ABCD Chart Pattern.
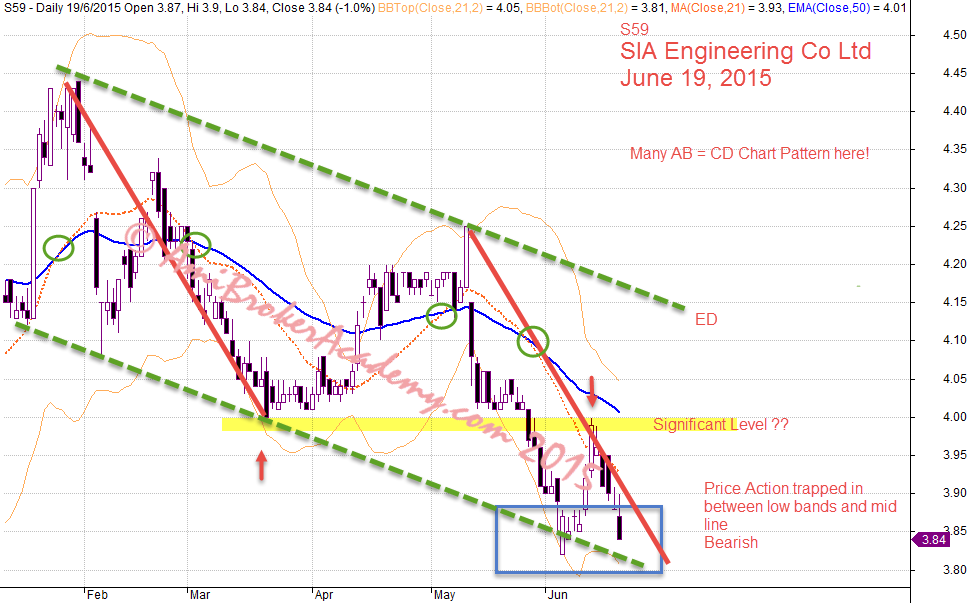
June 19, 2015 SIA Engineering Co Close Up View
3) Bear Trap?
Can this Bear Trap come true? Only till the chart pattern completed, the Bear Trap is still in question.
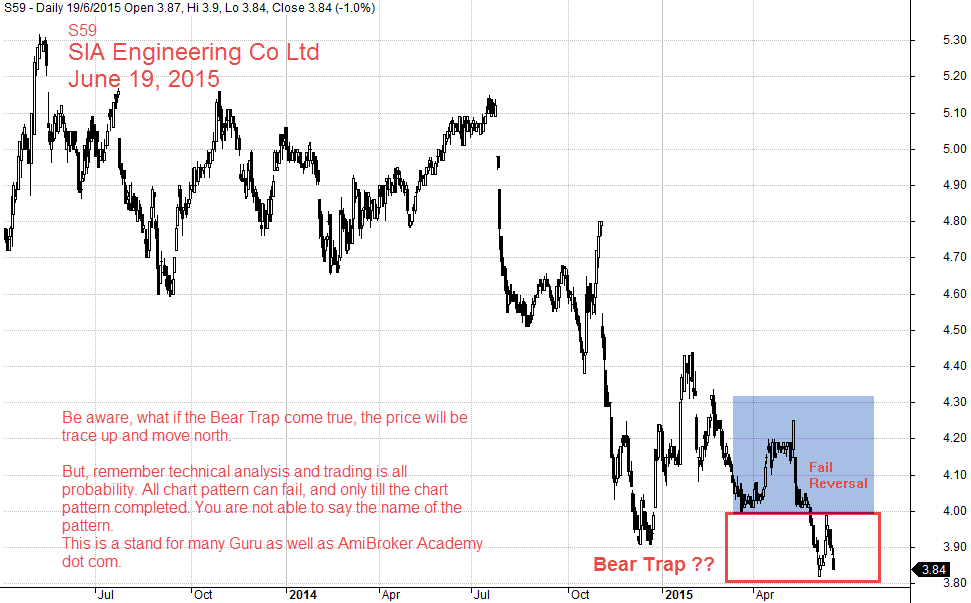
June 19, 2015 SIA Engineering Co and Bear Trap
4) Big Picture of S59
This big picture could be worrisome, as the price will be event more bearish than now.

June 19, 2015 SIA Engineering Co Daily Data From 2012
Trade Strategy
Our believe is Buy when price action bounce above MA, sell when price rejected by MA. Only enter buy after price near support and completed bullish chart pattern (candlestick), and sell when the price is near resistant and price action completed bearish chart pattern.
The worrisome is the bearish bias persisted.
You can read about other Singapore Stocks scan in this website.
Thanks for visiting the website.
Moses
DISCLAIMER
Site advice, “Stock trading is not a get rich quick scheme and it is high risk”.
Information provided here is of the nature of a general comment only and no intend to be specific for trading advice. It has prepared without regard to any particular investment objectives, financial situation or needs. Information should NOT be considered as an offer or enticement to buy, sell or trade.
You should seek advice from your broker, or licensed investment advisor, before taking any action.
The website does not guarantee any results or investment return based on the information and instruction you have read here. It should be used as learning aids.