December 20, 2016
Right All the Time
Do you think many of the famous traders made all their money because they was right (right all the times)?
No.
US Stock Analysis
GSK Glaxo SmithKline
Price break below the level, brown line. If the price action can close above the level, the price remain bearish.
Moving average is a great visual tool, you see the price action is below the MAs, or 34 EMA Wave, and the price action is resisted by the Wave. So, trade wisely.
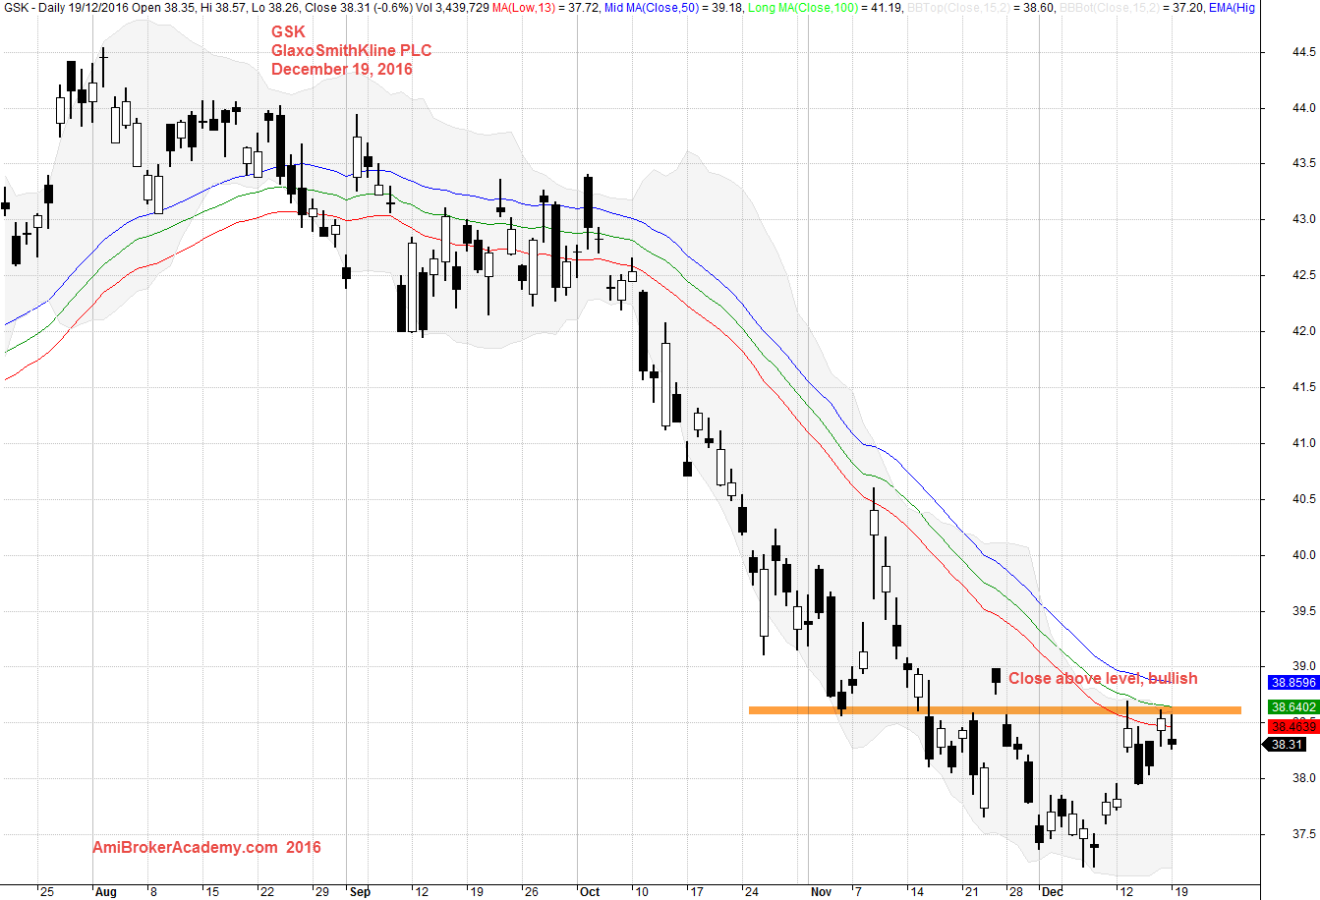
December 19, 2016 GSK Glaxo SmithKline Daily
GSK Glaxo SmithKline Dialy 2014 – 2016
From the three year chart, we see the price action in distribution mode. So 2017 strategy, buy support and sell resistance.
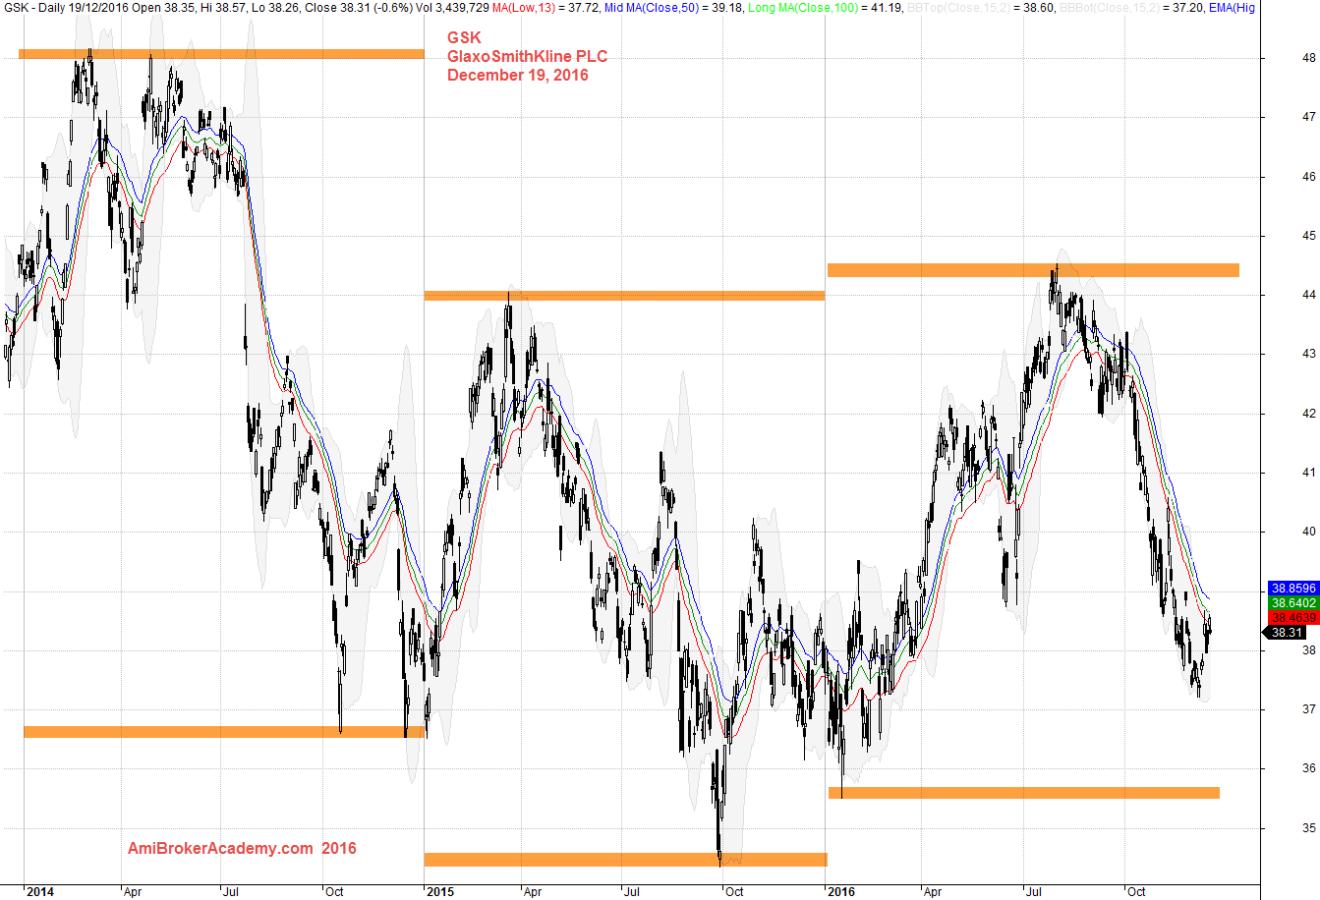
20161219 GSK Glaxo SmithKline 2014 -2016 Daily
Moses Free Stock Analysis
AmiBrokerAcademy.com
December 15, 2016
Disclaimer:
The discussion here is for educational purposes only. All information, data, symbols and trading ideas discussed hereby are the author or authors intend to demonstrate or illustrate purposes only. These are not recommendations or advice. It is not to be construed or intended as providing trading or legal advice.
Besides that this discussion is not an offer or solicitation of any kind in any jurisdiction where any AmiBrokerAcademy.com or its affiliate is try to do business.
Please note that active trading is not suitable for everyone. Any decisions you make about your trading or investment are important to you and your family, therefore should be made in consultation with a competent financial advisor or professional. We are not financial advisor and do not claim to be one.
Any views expressed here-in are not necessarily those held by amibrokeracademy.com.