December 30 2020
Planning for 2021 Trades
Welcome to AmiBroker Academy dot com. Thanks for searching and landed here. We use organic search to surface this site. If you find the site through some keywords. We would like to congratulate you. Good job and have fun!
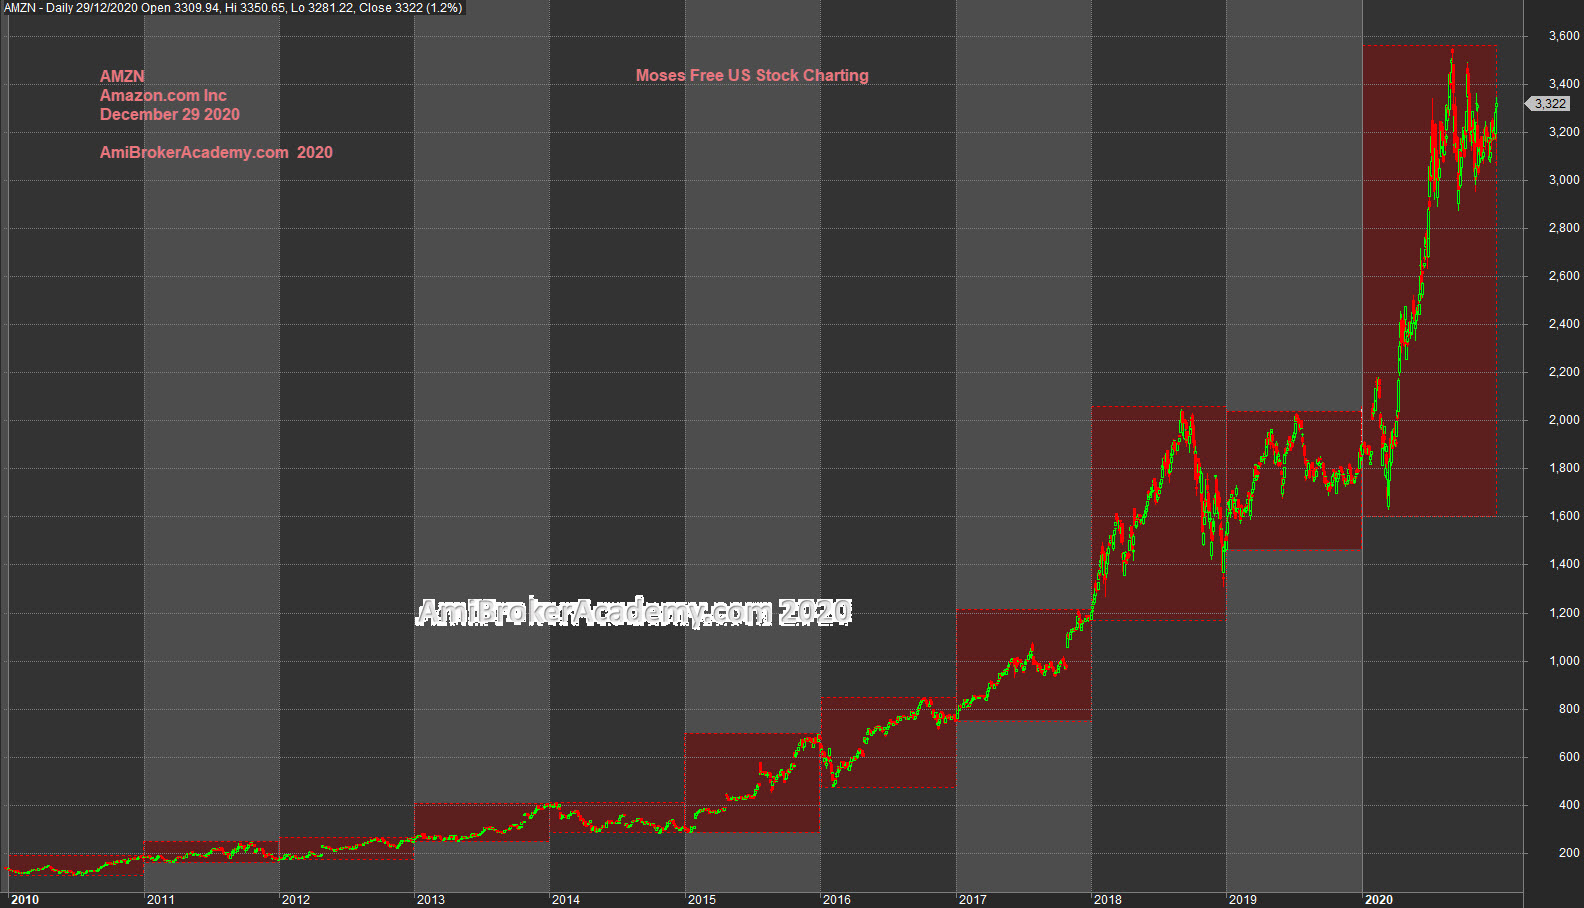
AMZN | Amazon.com Inc Stock Charting From 2010
Box is a great way to quick view the period high low, such as week, month, quarter or year.
Picture worth a thousand words, see chart. Price Action shot up in 2020.
2018 and 2019 have the same high. Price Action breakout the 2018 and 2019 resistance.
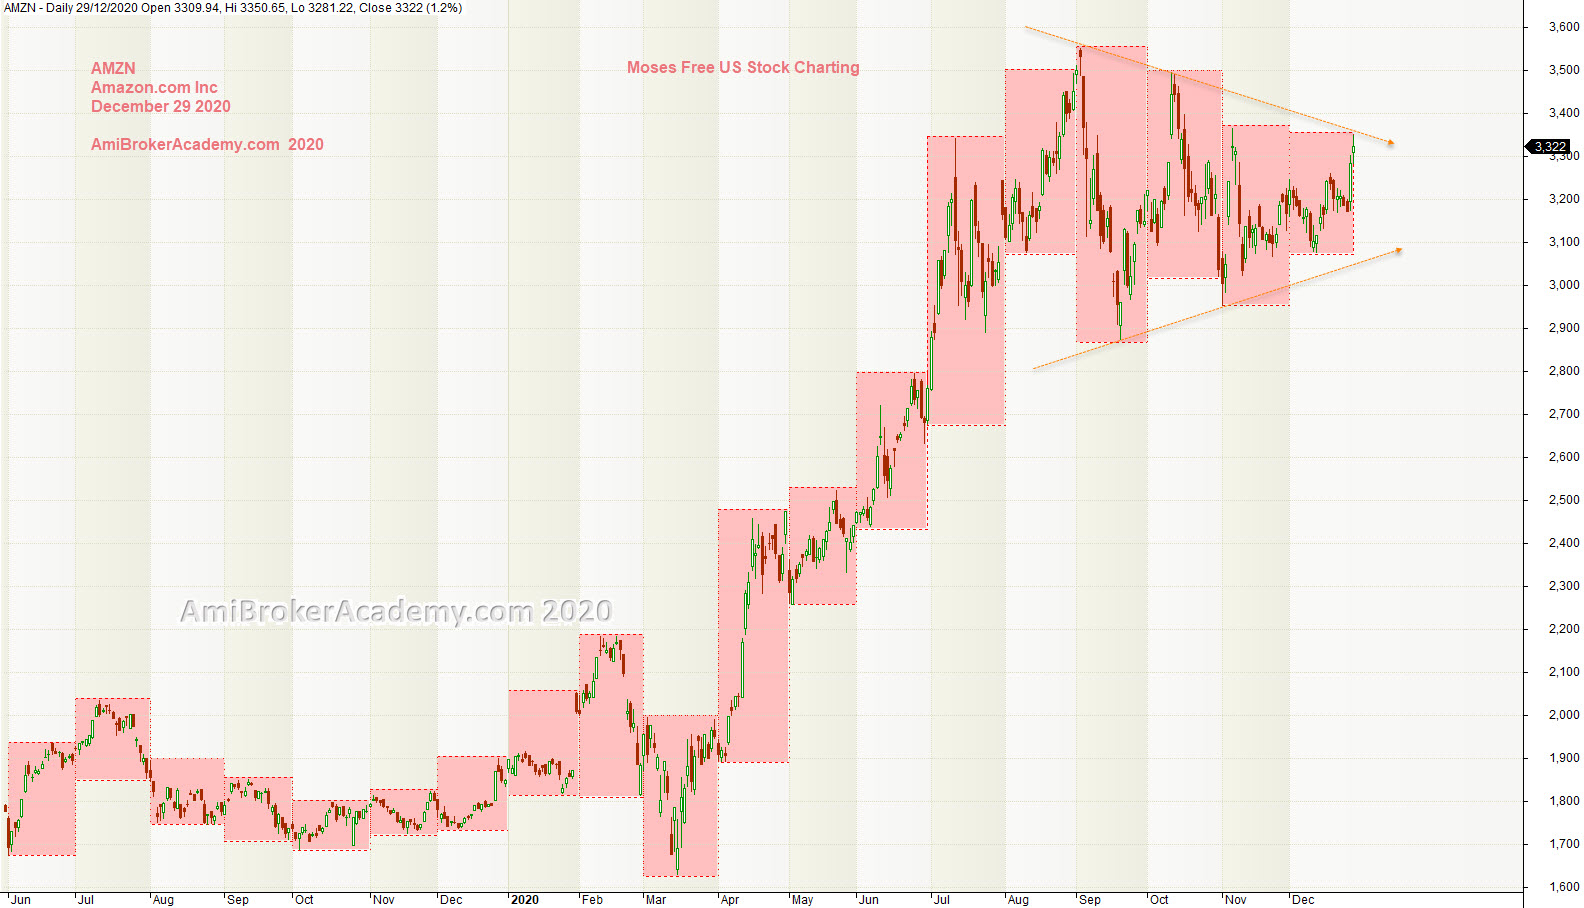
AMZN | Amazon.com Inc Stock Charting and Eighteen Months Data
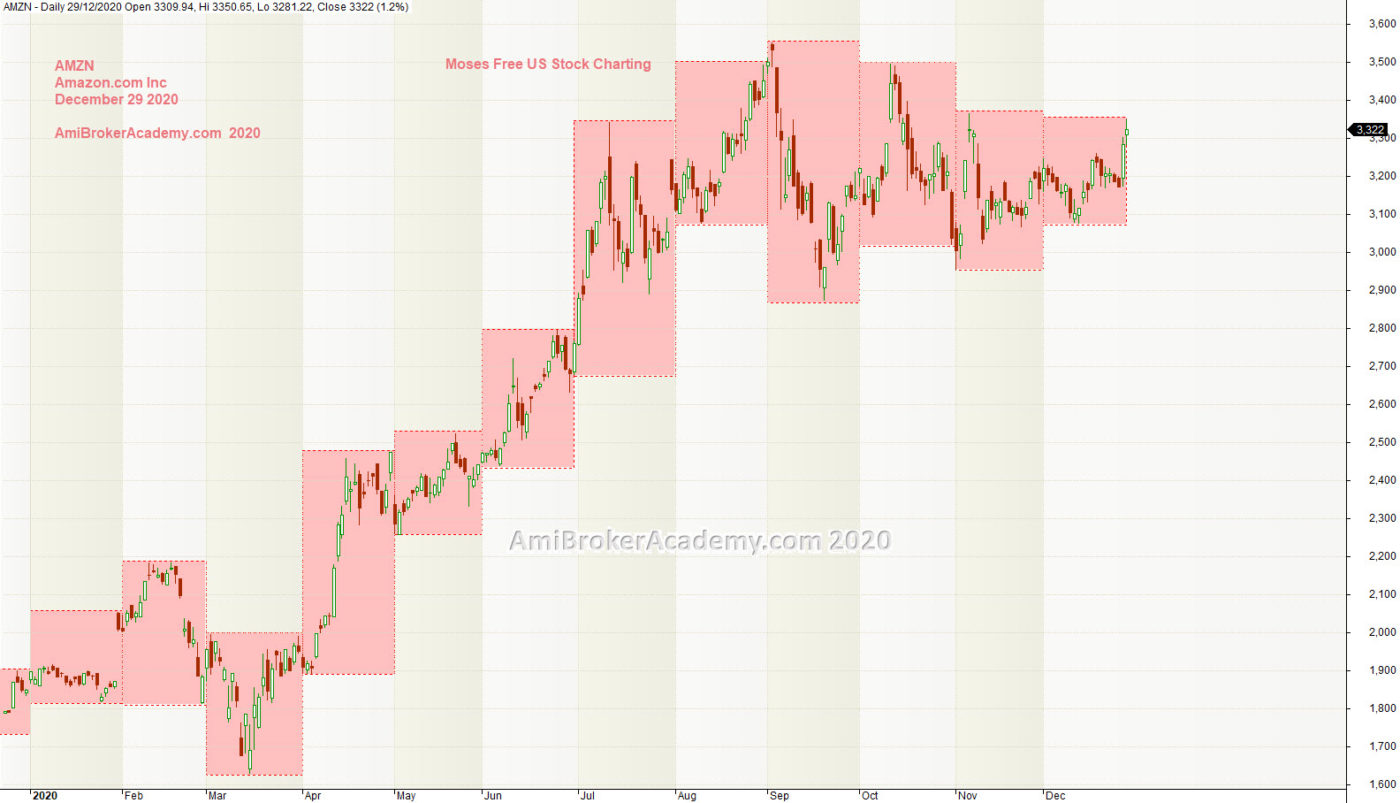
AMZN | Amazon.com Inc Stock Charting for Last Twelve Months
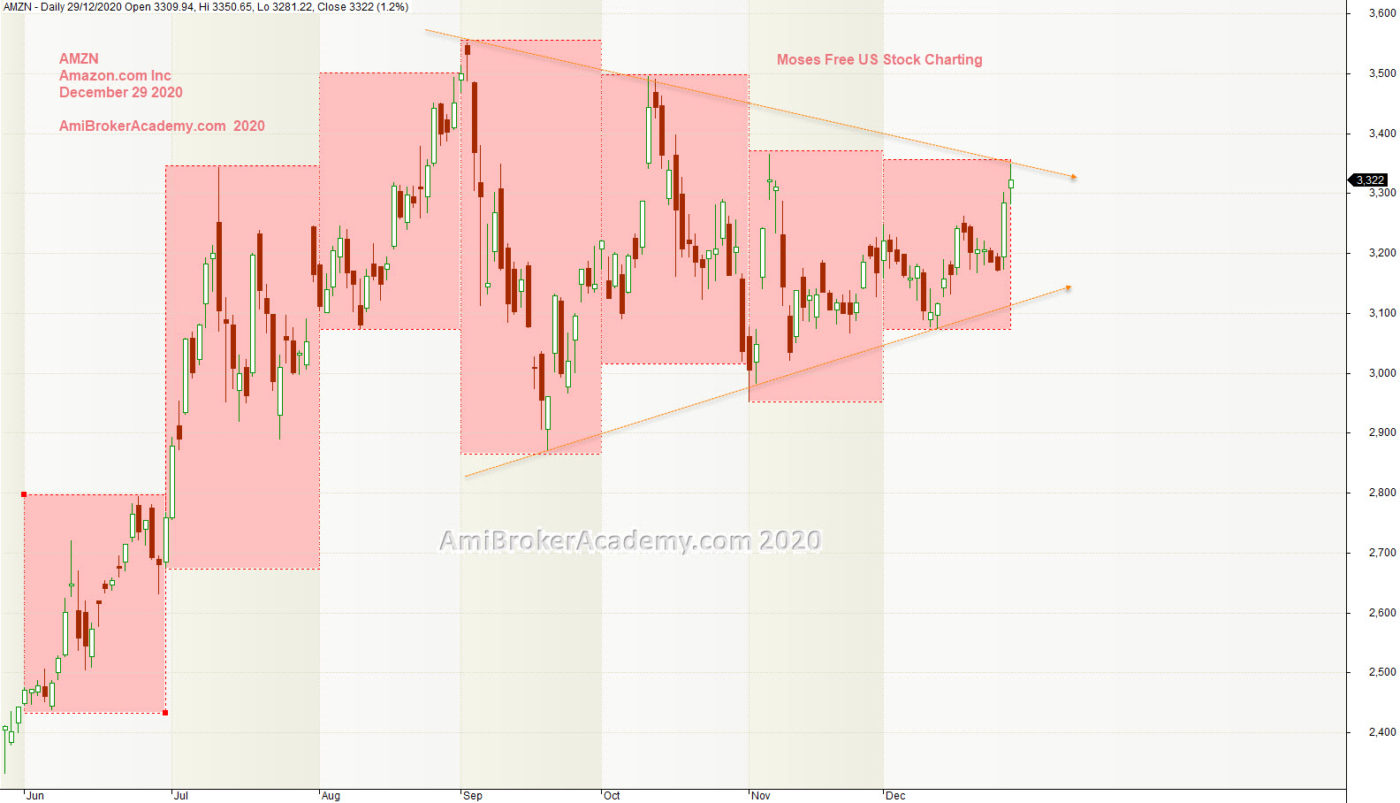
AAPL | Apple Inc Stock Chart and Six Months Data
Price Action is declining from September.
Moses Free Stock Charting
Official AmiBrokerAcademy.com Charting
Disclaimer
We do not recommend buy or sell of any financial instrument. All information post here is to show the power of Amibroker charting software and technical analysis (TA). If you do not know what is TA, please find a training to go through.