Pacific Radiance Limited Stock Chart
Is it just a coincident or truly the stock price performance affected by the fall of oil price? From the chart, other than the big candlestick after the right shoulder after the neckline the rest are of small one. The big candlestick is normally from the institution, so there is a big sell down to get of this stock in October 2014 the rest of the time is retailers.
After nearly ten months to stabilise around 0.30, the price fail again. Why?
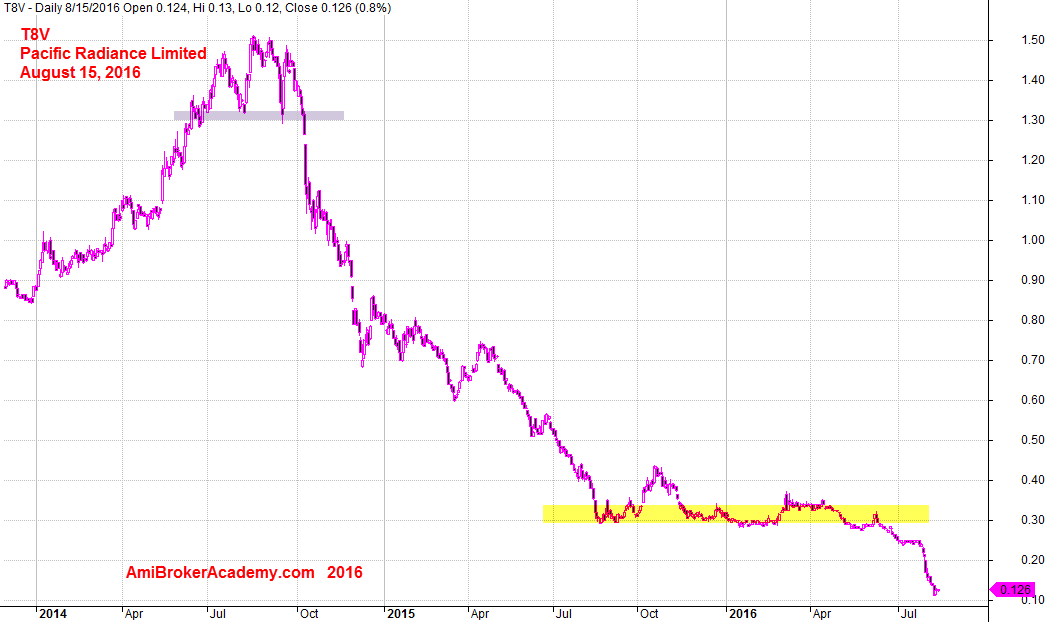
August 13, Pacific Radiance Limited Daily Chart
In a simple sense, the two looks related. Let’s monitor.
Moses Stock Analysis and Scan
AmiBrokerAcademy.com
Disclaimer: All information, data and material contained, presented, or provided on amibrokeracademy.com is for educational purposes only. It is not to be construed or intended as providing trading or legal advice. Decisions you make about your trading or investment are important to you and your family, therefore should be made in consultation with a competent financial advisor or professional. We are not financial advisor and do not claim to be. Any views expressed here-in are not necessarily those held by amibrokeracademy.com. You are responsible for your trade decision and wealth being.