October 13, 2016
The following are script generated signals using the Powerful AmiBroker AFL. AmiBroker is a powerful charting software. The results here are not meant to be used for buy or sell decisions. We do not vouch for their accuracy; the results are very much depending of the author trading rules. The postings are meant to demonstrate the powerful Amibroker charting software and its functionality.
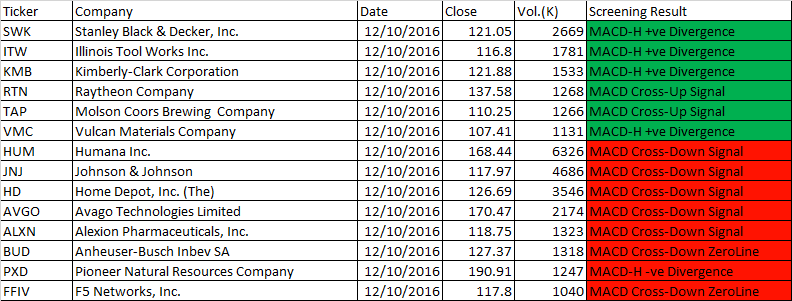
The Following are October 12, 2016 One-day US Stock MACD Screening Outcome
Next, NOT all scan results are shown here. We filter only those greater than 100 dollars and those more than 1,000k changing hands.
| Ticker | Company | Date | Close | Vol.(K) | Screening Result |
| SWK | Stanley Black & Decker, Inc. | 12/10/2016 | 121.05 | 2669 | MACD-H +ve Divergence |
| ITW | Illinois Tool Works Inc. | 12/10/2016 | 116.8 | 1781 | MACD-H +ve Divergence |
| KMB | Kimberly-Clark Corporation | 12/10/2016 | 121.88 | 1533 | MACD-H +ve Divergence |
| RTN | Raytheon Company | 12/10/2016 | 137.58 | 1268 | MACD Cross-Up Signal |
| TAP | Molson Coors Brewing Company | 12/10/2016 | 110.25 | 1266 | MACD Cross-Up Signal |
| VMC | Vulcan Materials Company | 12/10/2016 | 107.41 | 1131 | MACD-H +ve Divergence |
| HUM | Humana Inc. | 12/10/2016 | 168.44 | 6326 | MACD Cross-Down Signal |
| JNJ | Johnson & Johnson | 12/10/2016 | 117.97 | 4686 | MACD Cross-Down Signal |
| HD | Home Depot, Inc. (The) | 12/10/2016 | 126.69 | 3546 | MACD Cross-Down Signal |
| AVGO | Avago Technologies Limited | 12/10/2016 | 170.47 | 2174 | MACD Cross-Down Signal |
| ALXN | Alexion Pharmaceuticals, Inc. | 12/10/2016 | 118.75 | 1323 | MACD Cross-Down Signal |
| BUD | Anheuser-Busch Inbev SA | 12/10/2016 | 127.37 | 1318 | MACD Cross-Down ZeroLine |
| PXD | Pioneer Natural Resources Company | 12/10/2016 | 190.91 | 1247 | MACD-H -ve Divergence |
| FFIV | F5 Networks, Inc. | 12/10/2016 | 117.8 | 1040 | MACD Cross-Down ZeroLine |
What is MACD Moving Average Convergence Divergence
- MACD stands for Moving Average Convergence Divergence, the MACD line (red line or called fast line) and MACD signal line (blue line, or called slow line).
- MACD bullish signal when red line crosses above the blue line or MACD line crosses above zero line.
- MACD bearish signal when blue line crosses below red line or MACD line crosses below zero line.
The scanner helps to shortlist the stock for further technical analysis to determine the entry and exit point, and the risk involved.
October 12, 2016 Free One-day US Stock MACDScan Results
The following eliminated stocks less than $100, and less than 1,000,000 stocks changed hand. The results sorted by bull, bear and volume. The market is very bearish, based on the MACD signals.
12 October 2016 Free One-day US Stock MACD Scan Results
Note:
Users must understand what MACD is all about before using the results.
Have fun!
Moses US Stock MACD Scan
AmiBroker Academy.com