Welcome!
Welcome to AmiBrokerAcademy.com free MACD Singapore stock scan. Singapore stock scanner will run on a daily basis to help traders filter the stocks that are listing in Singapore Stock Exchange.
The Singapore MACD stock scan here will only identify stocks that have MACD bullish or bearish signal. The MACD scanner will only pick those stocks that have volume greater than 100K and have stock price more than a dollar.
Potentially for Singapore stocks that have bullish or bearish MACD signal could move in the near term. In TA the signal will be correct until the result has proven the signal was wrong.
Moving Average Convergence Divergence, MACD
For those we do not know what MACD is. MACD was developed by Gerald Appel in the late seventies.
- MACD stands for Moving Average Convergence Divergence, the MACD line (red line or called fast line) and MACD signal line (blue line, or called slow line).
- MACD Bullish Signal Line Cross: MACD bullish signal when red line crosses above the blue line or MACD line crosses above zero line.
- MACD Bearish Signal Line Cross: MACD bearish signal when blue line crosses below red line or MACD line crosses below zero line.
MACD Scan
There are 12 stocks picked for today. The following are the 12 stocks that passed our selection criteria for MACD scan script that closed on January 6, 2012. These stocks are volume exceeding 100K and price above one dollar.
8 stocks are having bullish MACD signal and 4 are having bearish signal.
| Company | type | Close | Vol.(K) | Screening Result |
| UOL GROUP LIMITED | bullish |
4.1 |
289 |
MACD Cross-Up ZeroLine |
| SIA ENGINEERING CO LTD | bullish |
3.46 |
174 |
MACD Cross-Up ZeroLine |
| SUNTEC REAL ESTATE INV TRUST | bullish |
1.135 |
3321 |
MACD Cross-Up ZeroLine |
| CAPITACOMMERCIAL TRUST | bullish |
1.08 |
2961 |
MACD Cross-Up ZeroLine |
| SINGAPORE AIRLINES LTD | bullish |
10.31 |
789 |
MACD Cross-Up ZeroLine |
| JARDINE STRATEGIC HLDGS LTD | bullish |
29.85 |
297 |
MACD Cross-Up ZeroLine |
| VENTURE CORPORATION LIMITED | bullish |
6.39 |
182 |
MACD Cross-Up ZeroLine |
| DBXT MSCI RUSSIA CAP 25 ETF 10 | bullish |
2.8 |
161 |
MACD Cross-Up ZeroLine |
| NEPTUNE ORIENT LINES LIMITED | bearish |
1.17 |
8754 |
MACD-H -ve Divergence |
| NOBLE GROUP LIMITED | bearish |
1.13 |
35101 |
MACD Cross-Down Signal |
| RAFFLES MEDICAL GROUP LTD | bearish |
2.09 |
284 |
MACD Cross-Down ZeroLine |
| MANDARIN ORIENTAL INTL LTD | bearish |
1.48 |
159 |
MACD Cross-Down ZeroLine |
Straits Times Index, Singapore stock market benchmark, STI for market ended January 6, 2012
O = 2708.45 points
C = 2715.59 points
H = 2717.60 points
L = 2699.81 points
Singapore stock market continues to be bullish, the Straits Times Index, STI closed at 2715.59 points. It is 2.57 points higher than the previous day market closed.
Straits Times Index Daily Chart, for market ended January 6, 2012
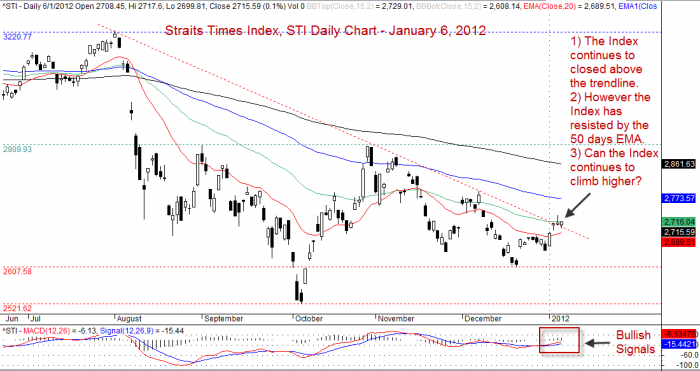
Straits Times Index, STI Daily Chart - January 6, 2012
By Moses
DSICLAIMER
Information provided here is of the nature of a general comment only and no intend to be specific for trading advice. It has prepared without regard to any particular investment objectives, financial situation or needs. Information should not be considered as an offer or enticement to buy, sell or trade.
You should seek advice from your broker, or licensed investment advisor, before taking any action.
Once again, the website does not guarantee any results or investment return based on the information and instruction you have read here. It should be used as learning aids only and if you decide to trade real money, all trading decision should be your own.
These are script generated signals. Not all scan results are shown here. The MACD signal should use with price action. Users must understand what MACD and price action are all about before using them. If necessary you should attend a course to learn more on Technical Analysis (TA) and Moving Average Convergence Divergence, MACD.