Noble Group Limite, N21
Moving Average a Powerful Visual Tool for Chart Analysis
Moving Average (MA) is a powerful aids in chart analysis. You can easily identify bullish or bearish bias trading trend. You could plan you bullish or bearish trading strategy.
Picture Worth a Thousand Words
In the following chart, you can easily identify price action crosses above the fast MA and slow MA and bounces above fast MA from February to April 2015. Thereafter the price action crosses below fast MA and continue to stay below fast MA till now.
In short, the price below fast MA, fast MA below slow MA.
We see divergence, bullish divergence. Price may change direction. Will see.
We see a build up on ABCD sell pattern. True or true!
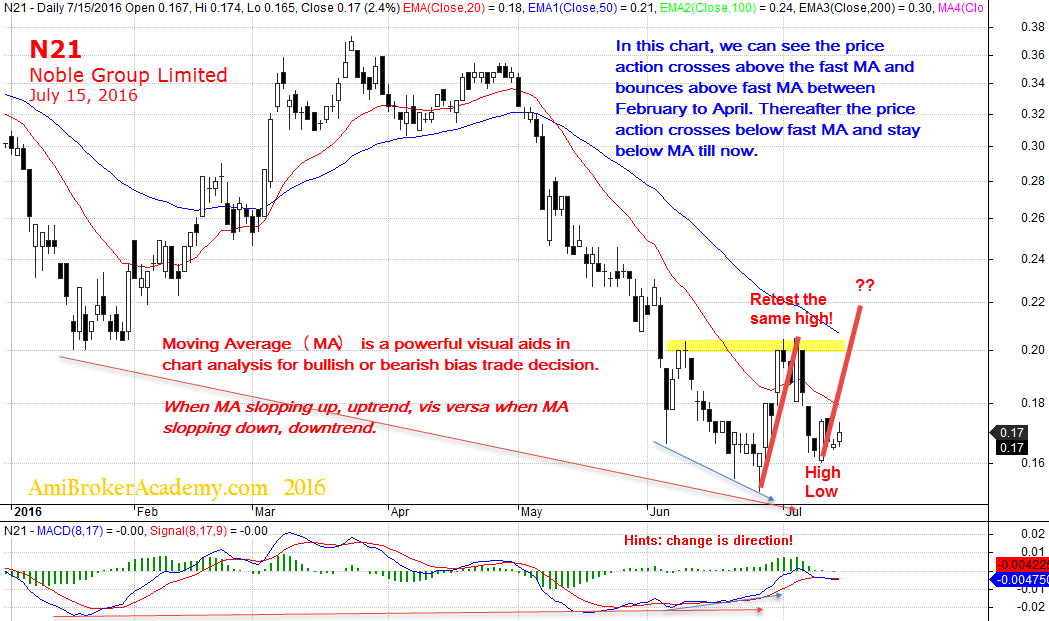
July 15, 2016 Noble Group Limited Stock Chart
If you have trouble see the chart clearly on the trend, turn to line chart for a clear view. Have fun!
Thanks for visiting the site, you can find many other analysis and concepts on this site. Have fun!
Moses Stock Analysis and Scan
Disclaimer: All information, data and material contained, presented, or provided on amibrokeracademy.com is for educational purposes only. It is not to be construed or intended as providing trading or legal advice. Decisions you make about your trading or investment are important to you and your family, therefore should be made in consultation with a competent financial advisor or professional. We are not financial advisor and do not claim to be. Any views expressed here-in are not necessarily those held by amibrokeracademy.com. You are responsible for your trade decision and wealth being.