May 2, 2018
Thanks for visiting the site, AmiBrokerAcademy.com.
US Stock Analysis
BA Boeing Company and MA Wave
Study Boeing Company using Moving Average. Moving Average is a great visual tool for trend. When price action bouncing above the MA, and the MA is slopping up. It is bullish. The opposite is bearish. You could lost when you buy in a bullish trend, because you buy at the high and expect to sell higher. The the opposite is true too, when you sell in a bullish trend you could still make money as you sell the peak of a bull trend. Manage your risk and under the price action.
You should combine a few tools to aid your trading. Manage your risk.
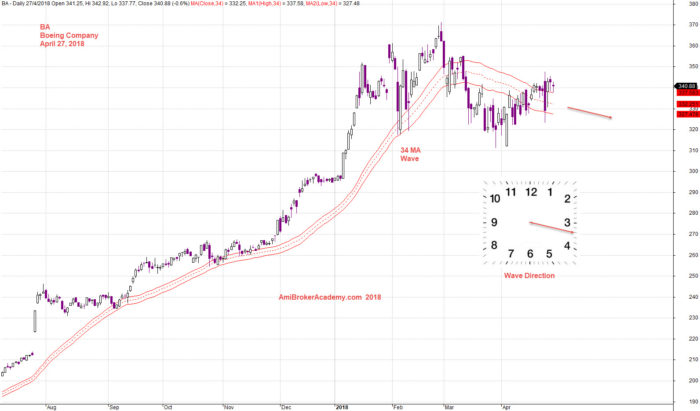
April 27, 2018 Boeing Company and MA Wave
BA Boeing Company and MACD
Picture worth a thousand words, see chart for more. MACD is a leading indicator for trend change. But also remember, all setup can fail. Manage your risk.
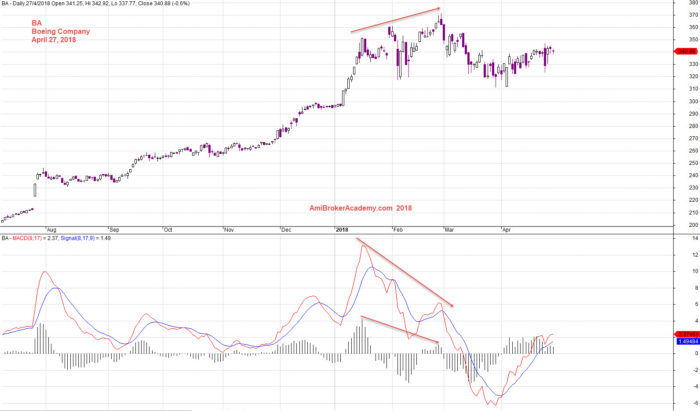
April 27, 2018 Boeing Company and MACD
Moses Stock Analysis
AmiBrokerAcademy.com
Disclaimer: All information, data and material contained, presented, or provided on amibrokeracademy.com is for educational purposes only. It is not to be construed or intended as providing trading or legal advice. Decisions you make about your trading or investment are important to you and your family, therefore should be made in consultation with a competent financial advisor or professional. We are not financial advisor and do not claim to be. Any views expressed here-in are not necessarily those held by amibrokeracademy.com. You are responsible for your trade decision and wealth being.