15 February, 2019
Welcome to AmiBrokerAcademy.com. We provide US stock analysis for academy learning.
Think!
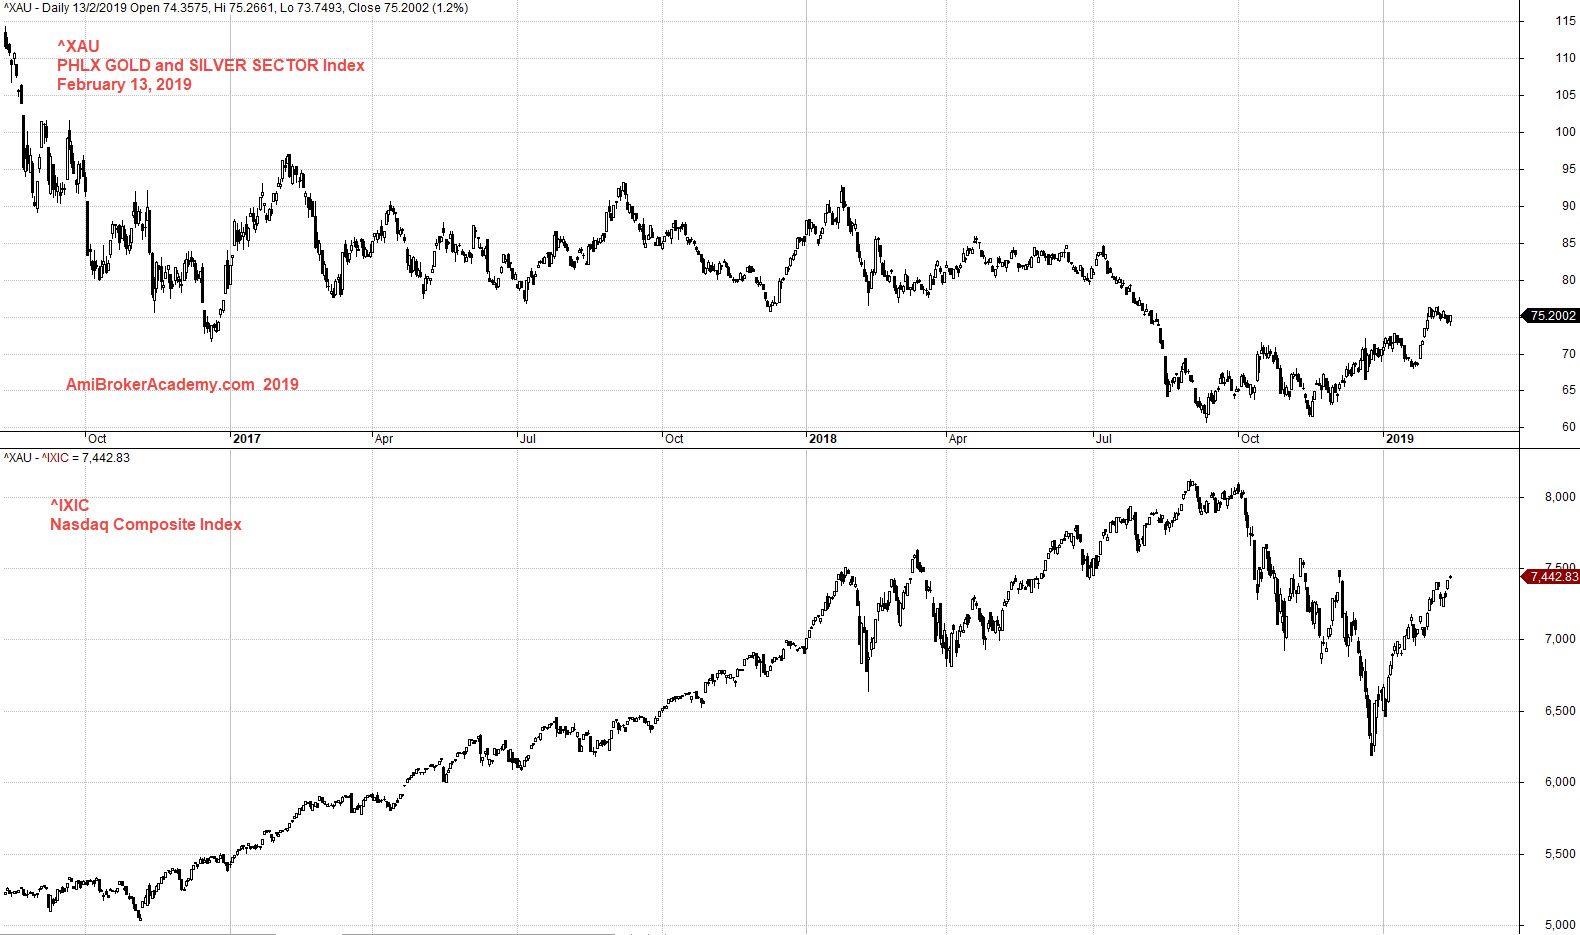
^XAU PHLX Gold and Silver Index Stock and US NASDAQ Composite Index Charting
Study PHLX Gold and Silver Index and US NASDAQ Composite Index correlation charting.
^XAU goes from high to low and NASDAQ stock Index in the reverse, goes from low to high.
So, when market is good, trader turns to stock market. On the other hand when market not so good, the traders will turn to such as gold or silver. This is just one interpretation. True or true? Will see.
Trade with eyes open.
Moses Stock Analysis
AmiBrokerAcademy.com
Disclaimer
The above result is for illustration purpose. It is not meant to be used for buy or sell decision. We do not recommend any particular stocks. If particular stocks of such are mentioned, they are meant as demonstration of Amibroker as a powerful charting software and MACD. Amibroker can program to scan the stocks for buy and sell signals.
These are script generated signals. Not all scan results are shown here. The MACD signal should use with price action. Users must understand what MACD and price action are all about before using them. If necessary you should attend a course to learn more on Technical Analysis (TA) and Moving Average Convergence Divergence, MACD.
Once again, the website does not guarantee any results or investment return based on the information and instruction you have read here. It should be used as learning aids only and if you decide to trade real money, all trading decision should be your own.