Moses’ Free MACD Singapore Stock Scan – April 30, 2014
Welcome to Moses’ Free Stock Scan Corner at AmiBrokerAcademy.com. Thank you for visiting the site. One of the reasons you are here because you want to know why the stock moves or which stocks will move in the near future.
This is April 30, 2014 Singapore stocks scan that has MACD bullish signal or bearish signal. The stock market benchmark, Straits Times Index closed at 3264.71 points. STI bounced up 26.97 points higher since the last closed at 3237.74 points. The bulls have return. Are the bears being defeated already? Although STI moved up, there were more bearish MACD signals. The STI is still at critical level 3200, can the market really break away from this critical level and move further north? Will see!
If you are new here, please check the previous posting on Straits Times Index analysis.
Technical Analysis
Technical Analysts use price charts to interpret what is the most likely of the next move or moves. Many of the technical analysis are based in geometry. Forefather and pioneer such as W D Gann began geometry and technical analysis was way back to 1930s.
Geometrically, STI has a reassembly AB=CD sell chart pattern. In TA, the chart pattern will hold true till it is being proven wrong. Trade with caution! Mange your risk!
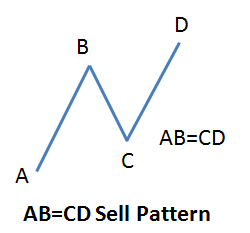
Geometry pattern, AB=CD Sell Pattern
Singapore Stock Market Benchmark Straits Times Index, STI Big Picture
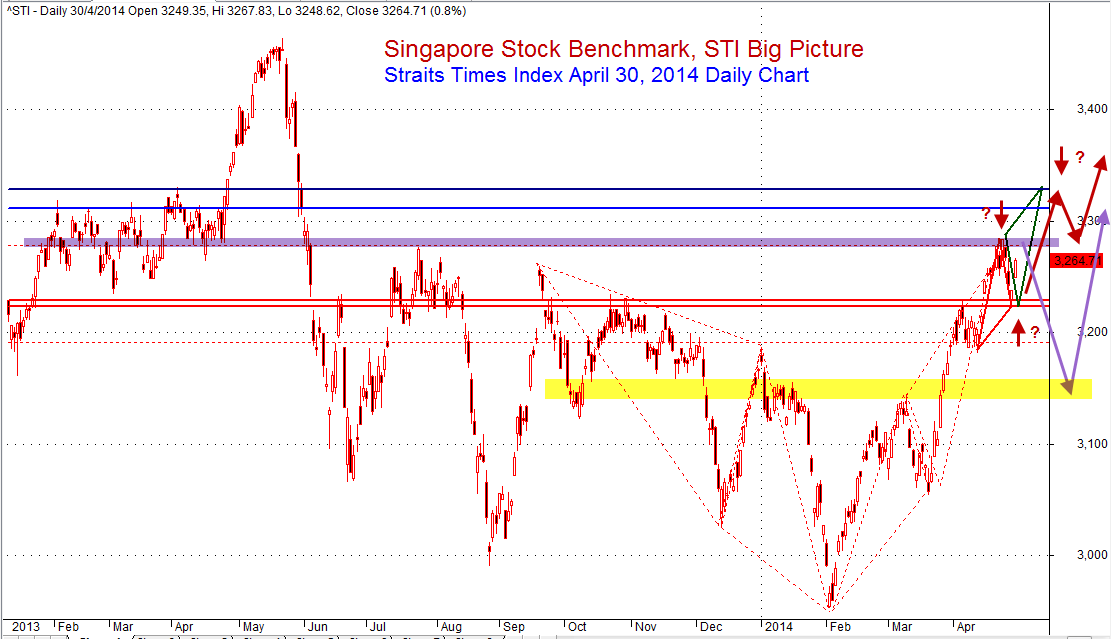
Singapore Stocks Benchmark, Straits Times Index, STI Big Picture April 30, 2014
SGX Benchmark Straits Times Index, STI April 30, 2014 Daily Chart
In the near term, can the index continue to break away and go further north? Will see.
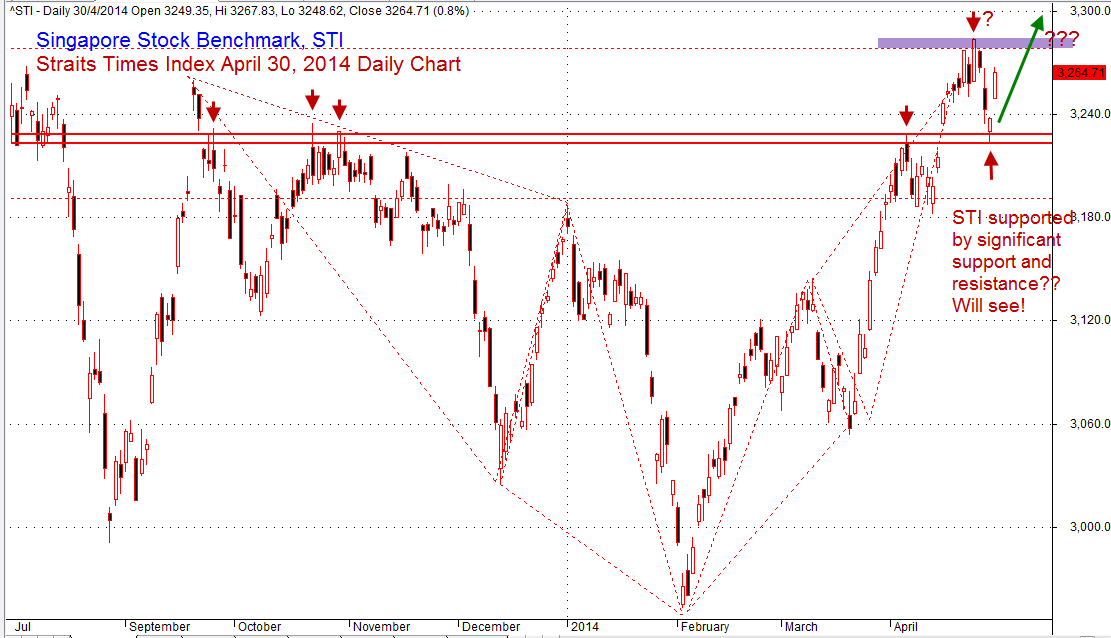
SGX Benchmark, Straits Times Index, STI April 30, 2014 Zoom In Daily Chart
Singapore Stocks April 30, 2014 MACD Scan Results
Singapore stocks April 30, 2014 MACD scan market outcome for MACD bullish or bearish signals. Total 74 stocks have MACD bullish or bearish signal. Out of 74 stocks have 27 stocks have bullish MACD signal and 47 stocks have bearish MACD signal. There are more bearish MACD signals. Only have 37 stocks have volume greater than 500k. There are more bearish MACD signal stocks that greater than 500k volume than bullish MACD signal stocks.
The following are the 37 stocks that have bullish and bearish MACD signals with volume greater than 500K.
| Ticker | Company | Signals | Close | Vol.(K) | Screening Result |
| KI3 | HU AN CABLE HOLDINGS LTD. | Bullish | 0.1 | 5986 | MACD Cross-Up Signal |
| SV3U | SOILBUILD BUSINESS SPACE REIT | Bullish | 0.785 | 3807 | MACD Cross-Up Signal |
| B2F | M1 LIMITED | Bullish | 3.36 | 2389 | MACD Cross-Up Signal |
| 5NG | HEALTHWAY MEDICAL CORP LTD | Bullish | 0.064 | 2195 | MACD-H +ve Divergence |
| P8Z | BUMITAMA AGRI LTD. | Bullish | 1.095 | 1684 | MACD Cross-Up Signal |
| 5CQ | TECHNICS OIL & GAS LIMITED | Bullish | 0.78 | 1480 | MACD Cross-Up Signal |
| G31 | GLOBAL TESTING CORPORATION LTD | Bullish | 0.081 | 1395 | MACD Cross-Up Signal |
| A0G | CHINA ENERGY LIMITED | Bullish | 0.052 | 1344 | MACD Cross-Up ZeroLine |
| QF6 | SWEE HONG LIMITED | Bullish | 0.26 | 1264 | MACD Cross-Up Signal |
| A30 | ASPIAL CORPORATION LIMITED | Bullish | 0.475 | 742 | MACD Cross-Up Signal |
| G13 | GENTING SINGAPORE PLC | Bearish | 1.325 | 21411 | MACD Cross-Down Signal |
| G4F | OTTO MARINE LIMITED | Bearish | 0.08 | 16449 | MACD Cross-Down Signal |
| 5RA | ASIA-PACIFIC STRATEGIC INV LTD | Bearish | 0.079 | 14760 | MACD-H -ve Divergence |
| J16 | GSH CORPORATION LIMITED | Bearish | 0.077 | 9814 | MACD Cross-Down Signal |
| K71U | KEPPEL REIT | Bearish | 1.21 | 8197 | MACD Cross-Down Signal |
| RE4 | GEO ENERGY RESOURCES LIMITED | Bearish | 0.295 | 7504 | MACD Cross-Down Signal |
| JS8 | CAPITAMALLS ASIA LIMITED | Bearish | 2.21 | 6477 | MACD Cross-Down Signal |
| 5HH | SINJIA LAND LIMITED | Bearish | 0.186 | 2669 | MACD-H -ve Divergence |
| C09 | CITY DEVELOPMENTS LIMITED | Bearish | 10.83 | 2502 | MACD Cross-Down Signal |
| Z59 | YOMA STRATEGIC HOLDINGS LTD | Bearish | 0.71 | 2297 | MACD Cross-Down Signal |
| N2IU | MAPLETREE COMMERCIAL TRUST | Bearish | 1.265 | 1949 | MACD Cross-Down Signal |
| OU8 | CENTURION CORPORATION LIMITED | Bearish | 0.715 | 1895 | MACD Cross-Down ZeroLine |
| 5IG | GALLANT VENTURE LTD. | Bearish | 0.3 | 1799 | MACD Cross-Down ZeroLine |
| 557 | VIKING OFFSHORE AND MARINE LTD | Bearish | 0.13 | 1290 | MACD Cross-Down ZeroLine |
| Y02 | YONGNAM HOLDINGS LIMITED | Bearish | 0.24 | 1274 | MACD Cross-Down Signal |
| 5VJ | HALCYON AGRI CORPORATION LTD | Bearish | 0.755 | 1224 | MACD Cross-Down ZeroLine |
| N03 | NEPTUNE ORIENT LINES LIMITED | Bearish | 1.015 | 1196 | MACD Cross-Down Signal |
| CY6U | ASCENDAS INDIA TRUST | Bearish | 0.765 | 1193 | MACD Cross-Down ZeroLine |
| U14 | UOL GROUP LIMITED | Bearish | 6.42 | 1153 | MACD Cross-Down Signal |
| 5FD | SWISSCO HOLDINGS LIMITED | Bearish | 0.425 | 1034 | MACD Cross-Down Signal |
| 560 | AZTECH GROUP LTD. | Bearish | 0.138 | 858 | MACD Cross-Down ZeroLine |
| V03 | VENTURE CORPORATION LIMITED | Bearish | 7.67 | 767 | MACD Cross-Down Signal |
| J85 | CDL HOSPITALITY TRUSTS | Bearish | 1.795 | 754 | MACD Cross-Down Signal |
| W05 | WING TAI HLDGS LTD | Bearish | 2 | 732 | MACD Cross-Down Signal |
| E3B | WEE HUR HOLDINGS LTD. | Bearish | 0.36 | 722 | MACD Cross-Down Signal |
| D38 | CDW HOLDING LIMITED | Bearish | 0.133 | 593 | MACD Cross-Down Signal |
| S7P | SOILBUILD CONSTRUCTION GRP LTD | Bearish | 0.26 | 517 | MACD Cross-Down Signal |
Moses
DISCLAIMER
Information provided here is of the nature of a general comment only and no intend to be specific for trading advice. It has prepared without regard to any particular investment objectives, financial situation or needs. Information should not be considered as an offer or enticement to buy, sell or trade.
You should seek advice from your broker, or licensed investment advisor, before taking any action.
Once again, the website does not guarantee any results or investment return based on the information and instruction you have read here. It should be used as learning aids only and if you decide to trade real money, all trading decision should be your own.