May 25, 2018
Thanks for visiting the site, AmiBrokerAcademy.com.
US Stock Analysis
^DJI Dow Jones Industrial Average Index Charting
See chart, picture worth a thousand words. Once a while is good to study the market index such as Dow Jones Industrial Average Index. See chart, the market just completed the standard ABCD, bullish ABCD pattern. Will it be a sell ABCD strategy? Will see.
From the trend, high low pattern, Dow start the bearish move from January 29 this year, forms a lower high. but same low. Now begin the lower high again. Trade with eyes open.
Manage your trade risk.
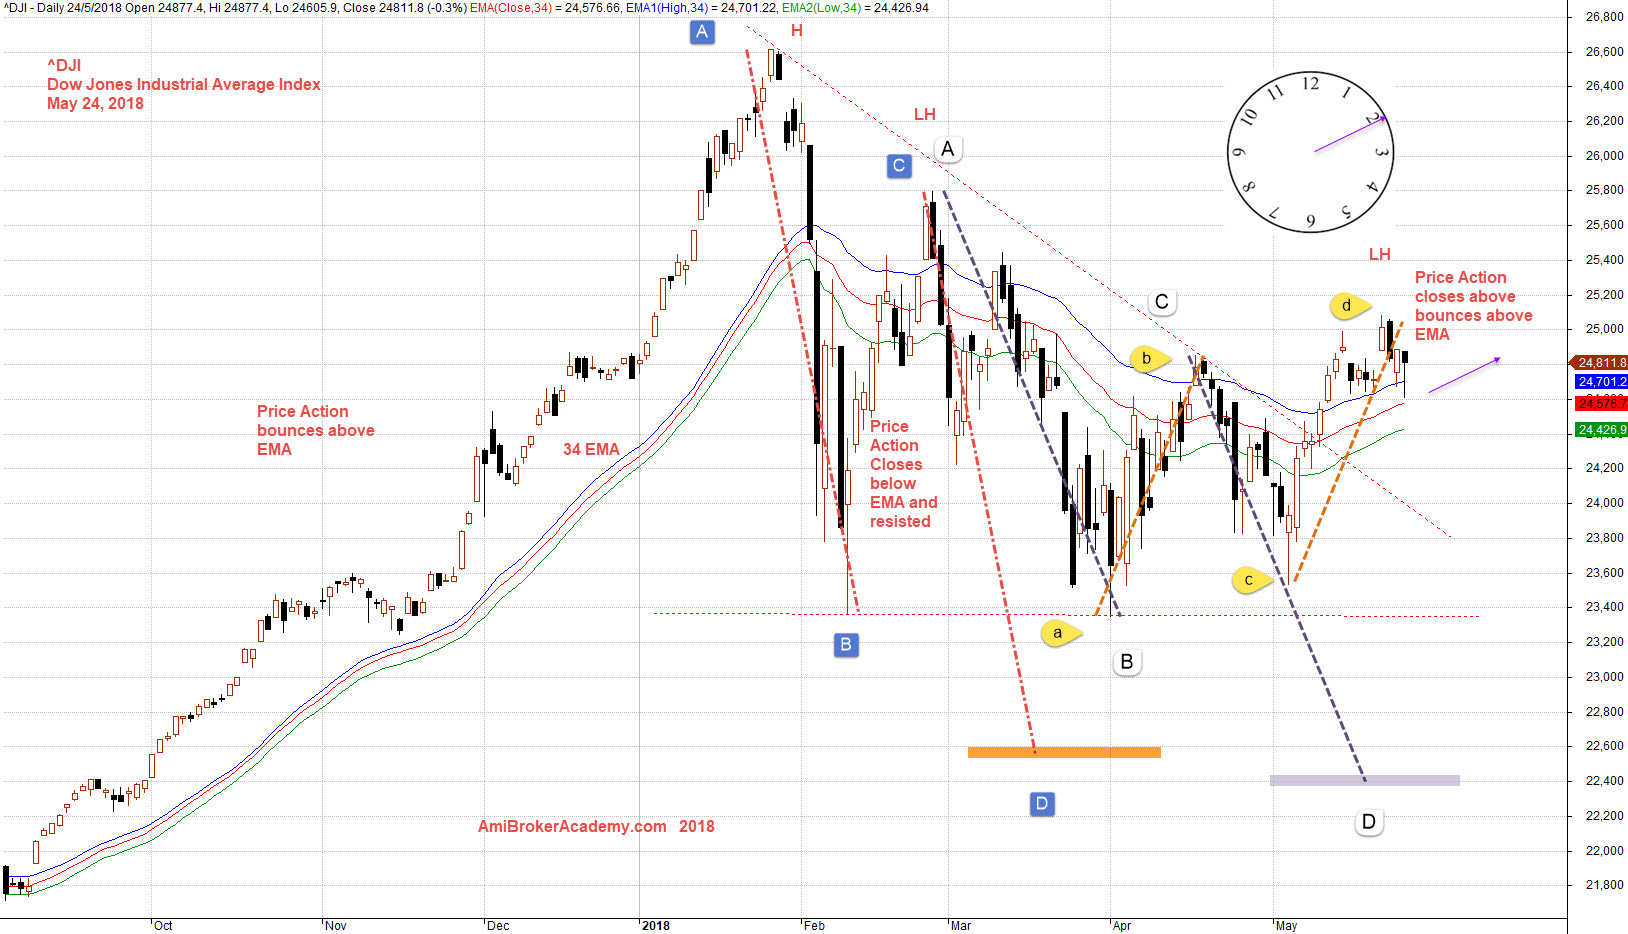
May 24, 2018 Dow Jones Industrail Average and MA Wave and ABCD Patterns
Moses Stock Analysis
AmiBrokerAcademy.com
Disclaimer: All information, data and material contained, presented, or provided on amibrokeracademy.com is for educational purposes only. It is not to be construed or intended as providing trading or legal advice. Decisions you make about your trading or investment are important to you and your family, therefore should be made in consultation with a competent financial advisor or professional. We are not financial advisor and do not claim to be. Any views expressed here-in are not necessarily those held by amibrokeracademy.com. You are responsible for your trade decision and wealth being.