March 19, 2015
Reading Chart Bar by Bar
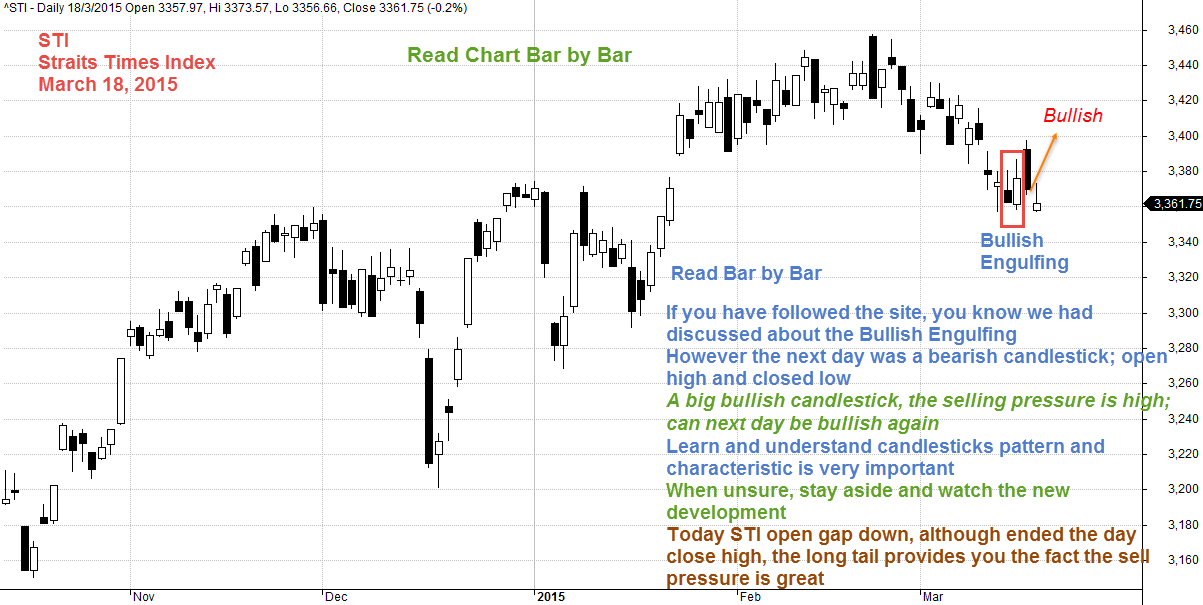
We first share the Big Picture of Singapore stocks benchmark Straits Times Index, STI. Now we zoom in to read the chart bar by bar. If you have followed the site, you will remember we highlighted that there was a Bullish Engulfing. The next day, there was a bearish candlestick, a big bearish candlestick. Pattern wise, looks bullish.
However, if you are very details. The candlestick is a Bearish candlestick, a Big Bearish candlestick. The emotions of the market is taking profit, sell off. Even it is bullish like, it is good to be understand the market is bearish bias. The safer bet is when unsure, stay aside.
March 18, STI open gap down 3357.97 points and drive STI high. The day still ended low 3361.75 points with a long tail.
You can find the Singapore Stock Market MACDScan to identify the stocks may move.
March 18, 2015 Straits Times Index, STI
Thanks for visiting this extra ordinary site, AmiBrokerAcademy.com.
Watch this space here, some great stock will be analyse here. See you more.
Moses
DISCLAIMER
Stock trading is not a get rich quick scheme and it is high risk.
Information provided here is of the nature of a general comment only and no intend to be specific for trading advice. It has prepared without regard to any particular investment objectives, financial situation or needs. Information should NOT be considered as an offer or enticement to buy, sell or trade.
You should seek advice from your broker, or licensed investment advisor, before taking any action.
Once again, the website does not guarantee any results or investment return based on the information and instruction you have read here. It should be used as learning aids.
Trading is personal. You are responsible for your own trading decision.
The comment is the author personal experience. There is no intent for your believe and follow.