May 15, 2014
Moses’ Stock Review and Free MACD Stock Scan
Should I buy or Sell?
No right! No wrong! There is no absolute true (value) but all are relative, relative to something. The buyer will perceive a value. For sure, when a stock price went up yesterday and goes up again today, it is because there were buyers yesterday and are buyers again today. Of course the buyers are willing to pay for a higher price to grab the stock available at the market at this moment (today).
However, when a price dips, this means the buyers think the price is expensive and stop buying. Or the buyers now turn sellers.
As a trader, you are responsible for your action, buy or sell the asset you want or you have. Look left and think right on a stock chart. A stock chart produced by tool like AmiBroker charting software. You look at the past price actions, volumes. You analyse the moving average, the strength to plan your strategy.
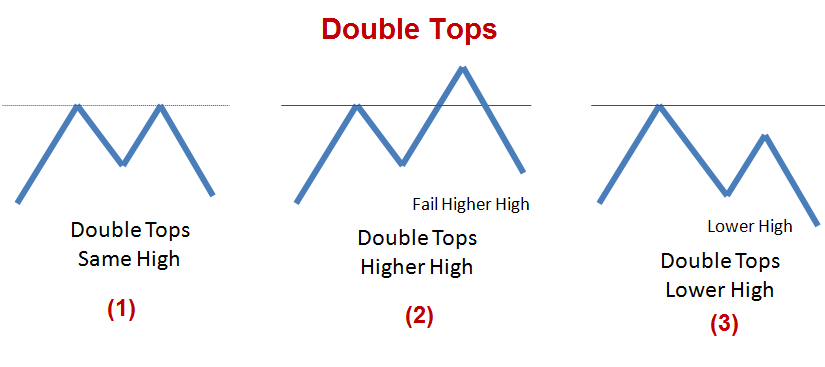
In a rally market, the price rise, then pullback, then another rise again. At some point, the price actions many reach a double top pattern.
What’s is double top pattern or patterns?
These are double top patterns; 1) same high, 2) higher than the last high, and 3) lower than the last high. Double top patterns are like a traffic light gives you warming of possible stop rising and change of direction. You as a trader, you need to learn how to recognise the pattern and make your decision. Use your whole brain thinking; left (logical) and right (graphical).
Please do not think trading is simple, it is a very intensive and all rounded profession. You need to use the whole brain at all time. Can you recognize these double tops? Or do you have problem to recognize them?
Type of Double Tops Chart Pattern
Moses Stock Scan uses AmiBroker charting software AmiBroker Formula Language, AFL program to scan through Singapore stocks that list in Singapore Stock Exchange, SGX to find stocks have Moving Average Convergence Divergence (MACD) bullish and bearish signals.
The MACD Scan is a scientific way in identifying the top stocks that have MACD signals on the previous day. You do not have to listen the market rumours to pick a stock.
May 15 2014 stock benchmark Straits Times Index closed 3272.49 point, STI rally another 13.4 points again from the last closed at May 14, 2014 3259.09 points.
Looks like the market continues to move north at the moment, the support of 3220 level is strong.
May 15, 2014 Straits Times Index, STI Daily Chart
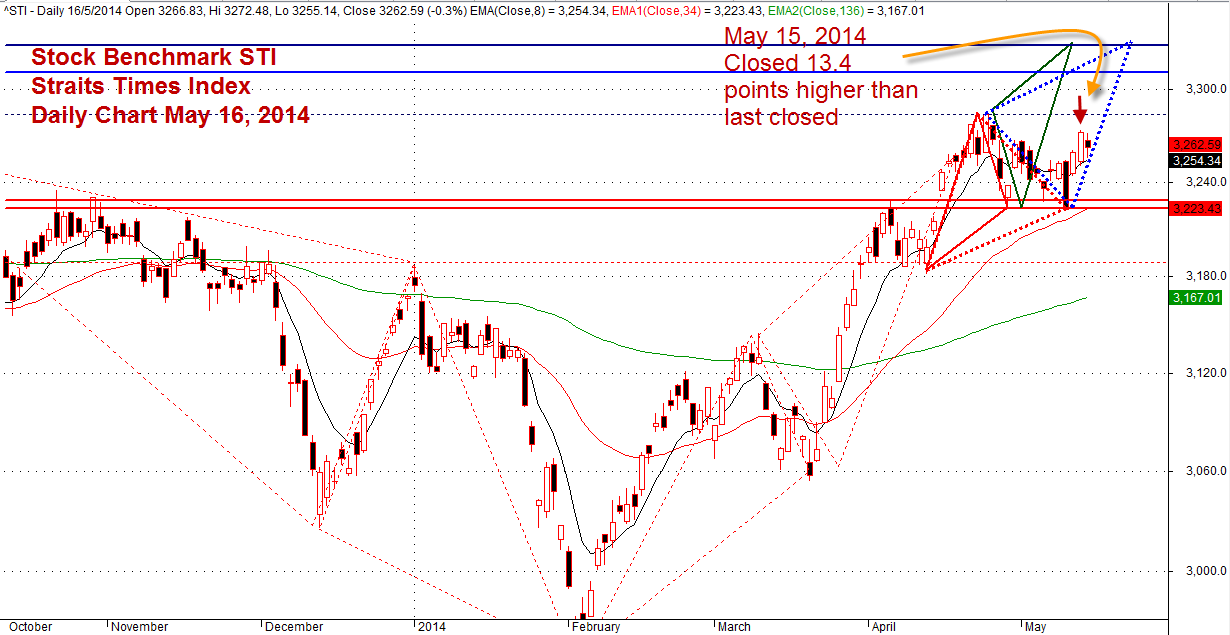
Stock Benchmark Straits Times Index, STI Daily Chart
May 15, 2014 Moses Free Stock MACD Scan Results
Free stock market scan results, Moses’ Stock Corner. Moses provides a list of Singapore stocks that have the following MACD signals.
- MACD line crosses above MACD signal – Bullish trend
- MACD line crosses above zero line – Bullish trend
- MACD Histogram +ve Divergence – Bullish trend
- MACD line crosses below MACD signal – Bearish trend
- MACD line crosses below zero line – Bearish trend
- MACD Histogram -ve Divergence – Bearish trend
- Volume traded greater 500,000 shares
Total 77 stocks have MACD bullish and bearish signals, only 45 stocks are traded more than 500,000 shares.
| Ticker | Company | Signals | Close | Vol.(K) | Screening Result |
| G13 | GENTING SINGAPORE PLC | bullish | 1.34 | 25260 | MACD-H +ve Divergence |
| A78 | LIONGOLD CORP LTD | bullish | 0.094 | 25171 | MACD-H +ve Divergence |
| Z74 | SINGTEL | bullish | 3.85 | 21029 | MACD Cross-Up Signal |
| S53 | SMRT CORPORATION LTD | bullish | 1.335 | 11844 | MACD Cross-Up Signal |
| MC0 | GLOBAL LOGISTIC PROP LIMITED | bullish | 2.85 | 10285 | MACD Cross-Up Signal |
| C38U | CAPITAMALL TRUST. | bullish | 2.03 | 9970 | MACD Cross-Up Signal |
| S24 | STATS CHIPPAC LTD | bullish | 0.385 | 8903 | MACD Cross-Up Signal |
| T4B | SINO GRANDNESS FOOD IND GP LTD | bullish | 0.67 | 5409 | MACD-H +ve Divergence |
| 5IG | GALLANT VENTURE LTD. | bullish | 0.305 | 5386 | MACD Cross-Up Signal |
| 5DE | EMS ENERGY LIMITED | bullish | 0.057 | 5120 | MACD +ve Divergence |
| C68 | MIRACH ENERGY LIMITED | bullish | 0.139 | 4190 | MACD-H +ve Divergence |
| S21 | GENTING HONG KONG LIMITED | bullish | 0.405 | 3922 | MACD Cross-Up Signal |
| H15 | HOTEL PROPERTIES LTD | bullish | 4.02 | 3816 | MACD Cross-Up Signal |
| S08 | SINGAPORE POST LIMITED | bullish | 1.435 | 2373 | MACD Cross-Up Signal |
| D5IU | LIPPO MALLS INDO RETAIL TRUST | bullish | 0.41 | 2328 | MACD Cross-Up ZeroLine |
| A68U | ASCOTT RESIDENCE TRUST | bullish | 1.2 | 2139 | MACD Cross-Up Signal |
| 5OU | CHINA ENVIRONMENT LTD. | bullish | 0.365 | 1566 | MACD-H +ve Divergence |
| 557 | VIKING OFFSHORE AND MARINE LTD | bullish | 0.126 | 1542 | MACD-H +ve Divergence |
| J10 | JAYA HOLDINGS LTD | bullish | 0.8 | 1491 | MACD Cross-Up Signal |
| 584 | OEL (HOLDINGS) LIMITED | bullish | 0.07 | 1332 | MACD Cross-Up Signal |
| H78 | HONGKONG LAND HOLDINGS LIMITED | bullish | 6.98 | 1204 | MACD Cross-Up Signal |
| SK3 | KRISENERGY LTD. | bullish | 0.705 | 1201 | MACD +ve Divergence |
| 566 | SEE HUP SENG LIMITED | bullish | 0.31 | 1097 | MACD Cross-Up Signal |
| RF1U | RELIGARE HEALTH TRUST | bullish | 0.86 | 1006 | MACD Cross-Up Signal |
| Y02 | YONGNAM HOLDINGS LIMITED | bullish | 0.245 | 936 | MACD Cross-Up Signal |
| NR7 | RAFFLES EDUCATION CORP LTD | bullish | 0.3 | 880 | MACD Cross-Up Signal |
| 5VJ | HALCYON AGRI CORPORATION LTD | bullish | 0.77 | 841 | MACD Cross-Up Signal |
| QF6 | SWEE HONG LIMITED | bullish | 0.235 | 795 | MACD Cross-Up Signal |
| MN5 | XINREN ALUMINUM HOLDINGS LTD | bullish | 0.455 | 506 | MACD Cross-Up Signal |
| S7OU | ASIAN PAY TELEVISION TRUST | bearish | 0.75 | 9906 | MACD Cross-Down Signal |
| O39 | OVERSEA-CHINESE BANKING CORP | bearish | 9.68 | 9368 | MACD Cross-Down Signal |
| AK3 | SWIBER HOLDINGS LIMITED | bearish | 0.615 | 5406 | MACD Cross-Down Signal |
| 5MC | BENG KUANG MARINE LIMITED | bearish | 0.185 | 5378 | MACD Cross-Down Signal |
| KI3 | HU AN CABLE HOLDINGS LTD. | bearish | 0.095 | 4082 | MACD Cross-Down Signal |
| M44U | MAPLETREE LOGISTICS TRUST | bearish | 1.15 | 2633 | MACD -ve Divergence |
| P40U | STARHILL GLOBAL REIT | bearish | 0.82 | 2458 | MACD -ve Divergence |
| J91U | CAMBRIDGE INDUSTRIAL TRUST | bearish | 0.75 | 1787 | MACD-H -ve Divergence |
| 5G1 | EUROSPORTS GLOBAL LIMITED | bearish | 0.28 | 1228 | MACD-H -ve Divergence |
| KJ9 | COGENT HOLDINGS LIMITED | bearish | 0.385 | 1073 | MACD Cross-Down Signal |
| MS7 | VARD HOLDINGS LIMITED | bearish | 1 | 1006 | MACD Cross-Down ZeroLine |
| S6NU | CROESUS RETAIL TRUST | bearish | 0.935 | 1000 | MACD-H -ve Divergence |
| SV3U | SOILBUILD BUSINESS SPACE REIT | bearish | 0.775 | 788 | MACD Cross-Down ZeroLine |
| M1Z | TEE INTERNATIONAL LIMITED | bearish | 0.29 | 744 | MACD Cross-Down Signal |
| K1Q | TTJ HOLDINGS LIMITED | bearish | 0.32 | 592 | MACD Cross-Down ZeroLine |
| 5HV | METAX ENGINEERING CORP LIMITED | bearish | 0.071 | 571 | MACD Cross-Down ZeroLine |
Moses
DISCLAIMER
Information provided here is of the nature of a general comment only and no intend to be specific for trading advice. It has prepared without regard to any particular investment objectives, financial situation or needs. Information should not be considered as an offer or enticement to buy, sell or trade.
You should seek advice from your broker, or licensed investment advisor, before taking any action.
Once again, the website does not guarantee any results or investment return based on the information and instruction you have read here. It should be used as learning aids only and if you decide to trade real money, all trading decision should be your own.