May 26, 2014
Moses’ Stock Review and Free MACD Stock Scan
Which stock may move? You may experience after you purchased a stock. The stock suddenly stops rally and start dipping, or only climbs a few cents. However, the moment you cut loss, the moment you sell the stock, the stock starts to move and move up in parabolic manner.
Trader needs powerful charting software to help in analysing the stock and the market, Moses uses AmiBroker charting software. Moses uses AmiBroker Formula Language, AFL program to scan through Singapore stocks that list in Singapore Stock Exchange, SGX to find stocks have Moving Average Convergence Divergence (MACD) bullish and bearish signals.
Trading indicator, MACD is like traffic light. It gives you early warning on the price direction. However, just like traffic light, sometime it will turn red and sometime it continues to stay green. You will only stop when turn red. Therefore, as trader you will wait for confirmation before action.
MACD Indicator gives you the early warning that the stock potentially movement. So the scan results help to narrow down the stocks to find confirmation.
May 26 2014 stock benchmark Straits Times Index, STI closed 3282.88 points, STI gaps up and rally 4.86 point from the last closed at 3278.02 points. But, but bulls and bears fight finally is indecision, Doji candlestick pattern. So, beware when Doji, study the chart, the Doji is near resistance. It is likely to form Doji Evening Star Candlestick pattern.
May 26, 2014 Straits Times Index, STI Daily Chart
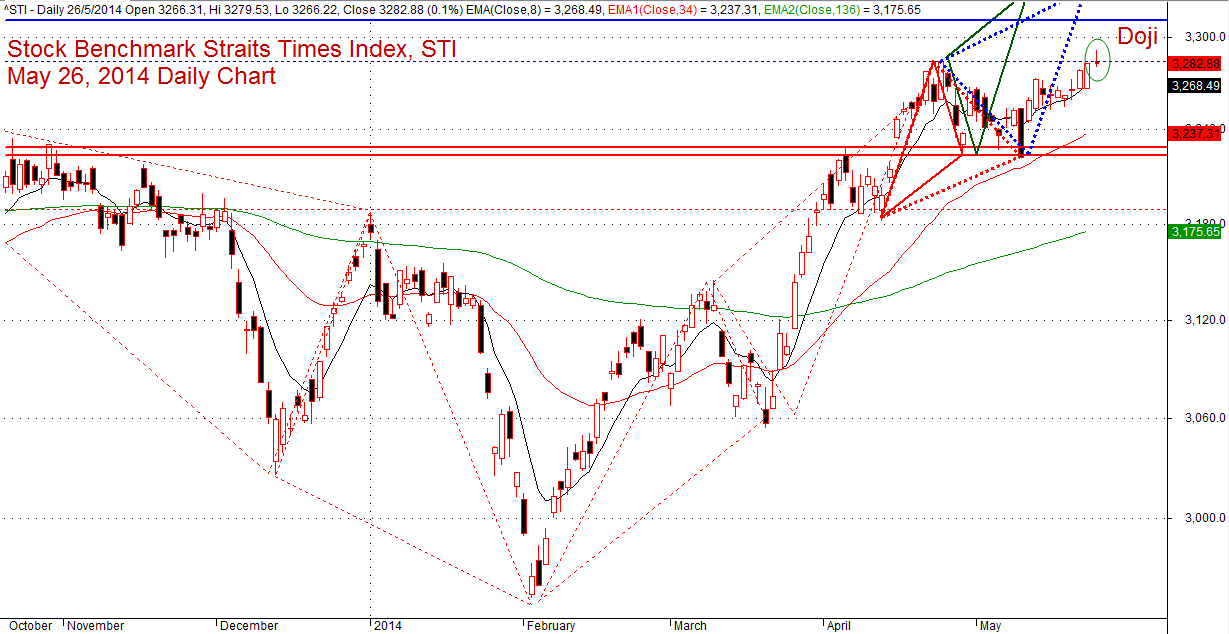
Stock Benchmark, STI, Straits Times Index May 26, 2014 Daily Chart
.
May 26, 2014 Moses Free Stock MACD Scan Results
Free stock market scan results, Moses’ Stock Corner. Moses provides a list of Singapore stocks that have the following MACD signals.
- MACD line crosses above MACD signal – Bullish trend
- MACD line crosses above zero line – Bullish trend
- MACD Histogram +ve Divergence – Bullish trend
- MACD line crosses below MACD signal – Bearish trend
- MACD line crosses below zero line – Bearish trend
- MACD Histogram -ve Divergence – Bearish trend
- Volume traded greater 500,000 shares
Total 55 stocks have MACD bullish and bearish signals, only 23 stocks are traded more than 500,000 shares.
| Ticker | Company | Signals | Close | Vol.(K) | Screening Result |
| 5GB | SIIC ENVIRONMENT HOLDINGS LTD. | Bullish | 0.164 | 66859 | MACD Cross-Up Signal |
| Y02 | YONGNAM HOLDINGS LIMITED | Bullish | 0.255 | 22867 | MACD Cross-Up Signal |
| MS7 | VARD HOLDINGS LIMITED | Bullish | 1.075 | 15863 | MACD Cross-Up ZeroLine |
| B9S | COSMOSTEEL HOLDINGS LIMITED | Bullish | 0.47 | 6352 | MACD Cross-Up Signal |
| KJ9 | COGENT HOLDINGS LIMITED | Bullish | 0.425 | 3966 | MACD Cross-Up Signal |
| OU8 | CENTURION CORPORATION LIMITED | Bullish | 0.74 | 2916 | MACD Cross-Up Signal |
| 557 | VIKING OFFSHORE AND MARINE LTD | Bullish | 0.127 | 2808 | MACD Cross-Up Signal |
| S51 | SEMBCORP MARINE LTD | Bullish | 4.06 | 2605 | MACD Cross-Up ZeroLine |
| J7X | TIGER AIRWAYS HOLDINGS LIMITED | Bullish | 0.42 | 2024 | MACD Cross-Up Signal |
| 5G2 | KIMHENG OFFSHORE&MARINE HLDLTD | Bullish | 0.245 | 1679 | MACD-H +ve Divergence |
| CC3 | STARHUB LTD | Bullish | 4.14 | 1554 | MACD Cross-Up Signal |
| D4N | CHINA NEW TOWN DEVT CO LIMITED | Bullish | 0.084 | 1295 | MACD Cross-Up Signal |
| 5CN | SINWA LIMITED | Bullish | 0.255 | 1193 | MACD Cross-Up Signal |
| F9D | BOUSTEAD SINGAPORE LIMITED | Bullish | 1.875 | 734 | MACD Cross-Up Signal |
| LJ3 | OUE LIMITED | Bullish | 2.35 | 722 | MACD Cross-Up Signal |
| B0Z | CHINA FISHERY GROUP LIMITED | Bullish | 0.36 | 612 | MACD Cross-Up Signal |
| BS6 | YANGZIJIANG SHIPBLDG HLDGS LTD | Bearish | 1.125 | 4177 | MACD Cross-Down Signal |
| EB5 | FIRST RESOURCES LIMITED | Bearish | 2.48 | 1902 | MACD Cross-Down ZeroLine |
| 583 | PROGEN HOLDINGS LTD | Bearish | 0.158 | 1301 | MACD Cross-Down Signal |
| F31 | FRAGRANCE GROUP LIMITED | Bearish | 0.22 | 741 | MACD Cross-Down ZeroLine |
| S7P | SOILBUILD CONSTRUCTION GRP LTD | Bearish | 0.25 | 595 | MACD Cross-Down ZeroLine |
| AU8U | CAPITARETAIL CHINA TRUST | Bearish | 1.52 | 529 | MACD-H -ve Divergence |
| F9M | KENCANA AGRI LIMITED | Bearish | 0.24 | 520 | MACD Cross-Down Signal |
Thanks for visiting the site. Hope you find the information is useful to you.
Moses
DISCLAIMER
Information provided here is of the nature of a general comment only and no intend to be specific for trading advice. It has prepared without regard to any particular investment objectives, financial situation or needs. Information should not be considered as an offer or enticement to buy, sell or trade.
You should seek advice from your broker, or licensed investment advisor, before taking any action.
Once again, the website does not guarantee any results or investment return based on the information and instruction you have read here. It should be used as learning aids only and if you decide to trade real money, all trading decision should be your own.