June 23, 2014
Markets Move in Repeating Fractal Price Patterns
Price swings, low to high or high to low. Until the price action is truly reversed the price swing isn’t completed. The trader or investor disastrous is to predict the end of price swing. However, it is always so clear when the pattern is truly completed, and the patterns repeated over the last few hundred years (since the technical analysis become known).
Knowing the patterns help plan your trade. However, enter the market is depending trigger.
A picture tells a thousand words, in trading it will be a chart tells a thousand words.
See the Hong Kong stock benchmark, Hang Seng Index, ^HSI. What the chart try to reveal to you? What can you get out of it? Depending which school you from, symmetry geometry, candlestick chart pattern, or the unknown one. See for yourself.
Many find it difficult to understand, where all major markets have being joining US to rally. Why Hong Kong and Singapore market are not following.
Hang Seng Index Weekly Chart AB=CD, Flag Chart Pattern
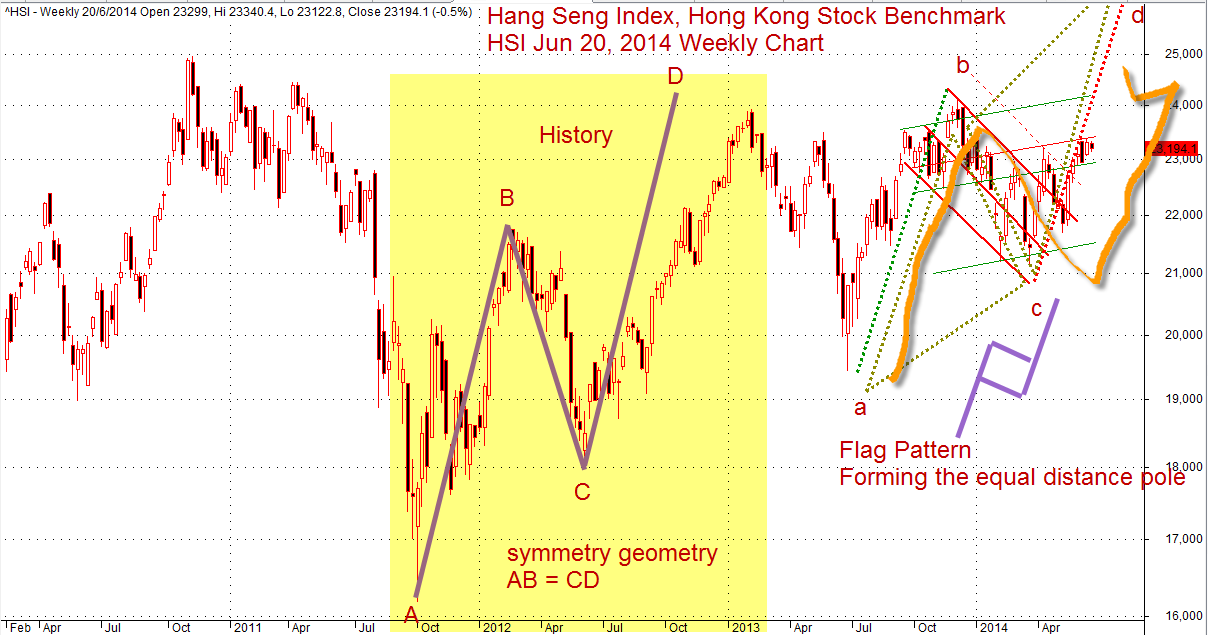
Hong Kong Stock Benchmark, HSI, Hang Seng Index Weekly Chart, June 20, 2014
.
Thanks for visiting the site, AmiBrokerAcademy.com.
Moses
DISCLAIMER
Information provided here is of the nature of a general comment only and no intend to be specific for trading advice. It has prepared without regard to any particular investment objectives, financial situation or needs. Information should not be considered as an offer or enticement to buy, sell or trade.
You should seek advice from your broker, or licensed investment advisor, before taking any action.
Once again, the website does not guarantee any results or investment return based on the information and instruction you have read here. It should be used as learning aids only and if you decide to trade real money, all trading decision should be your own.