January 24, 2017
A month a go, we analysed the Gold Silver Index and discussed the trading strategy. Let’s see the chart again now. What’s has changed?
Moses Stock Analysis – XAU
^XAU | PHLX Gold/Silver Index December 24 Last Year
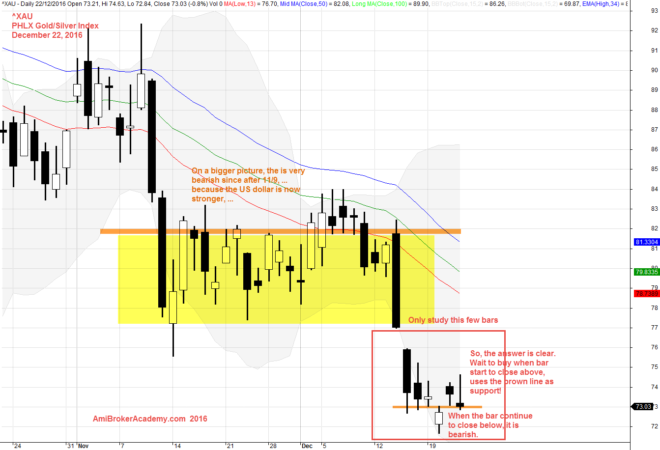
December 22, 2016 PHLX Gold/Silver Index
^XAU | PHLX Gold/Silver Index and 34 EMA Wave
We can not tell you buy or sell as we do not have the license to do so. We can only provide our analysis. We share with you what we see and understand, we speak out mind. We share with you we share an opportunity to buy when the support of the level does prove strength and effective. If you have read and monitor, you probably will test a small lot on the bullish signal.
That could mean you have position in 74 dollars and now it is 91 dollars. What a great joy! Remember all setup can fail. We use our technical analysis to decide what is our next cause of action.
You probably has observed that the price move in zigzag manner like snake. So, be aware the price action may have a pullback. A pullback to the optima zone, 34 EMA Wave.
Study the chart below, you will notice the price action has been below the 34 EMA wave and bounce off by the Wave. Now the XAU has closed above the Wave, and floating above the 34 EMA wave. If you understanding or observation is below wave bearish, above wave bullish. You will probably now understand the trend has changed direction. But, but this could be fake, in traders term. …
In 2017, this is a new year, really a new year. As this is a beginning for number of influencing leader take their position. Their words could spin the world around. Just to prove that you are listening. Do not got me wrong, not listening to me. It is listening to them. …
The market will continue to be volatile or many be even more volatile. But trader love volatile market, at least the market moves. You just need to be riding the wave. Watch out!
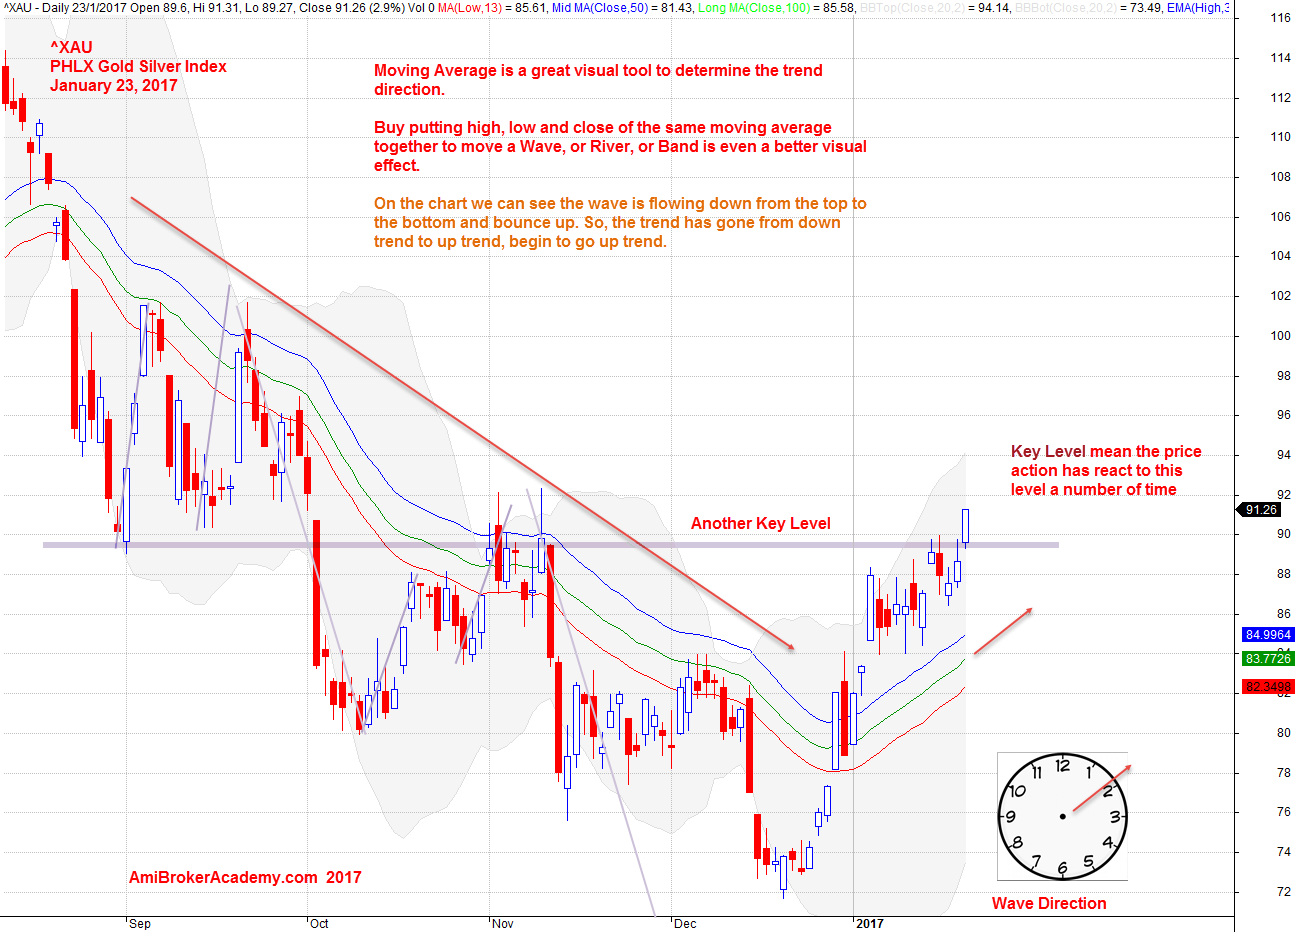
January 23, 2017 PHLX Gold Silver Index Daily and 34 EMA Wave
^XAU | PHLX Gold/Silver Index and 34 EMA Wave
Now, if you add the MACD indicator. You will probably see the sign from the indicator too. We see the indicator signal a possibly change in trend in our last analysis. But, reading bar by bar added more confident in understand where the trend will be going.
So, do not play play in reading the chart.
What goes up will come down. Be aware of pullback.
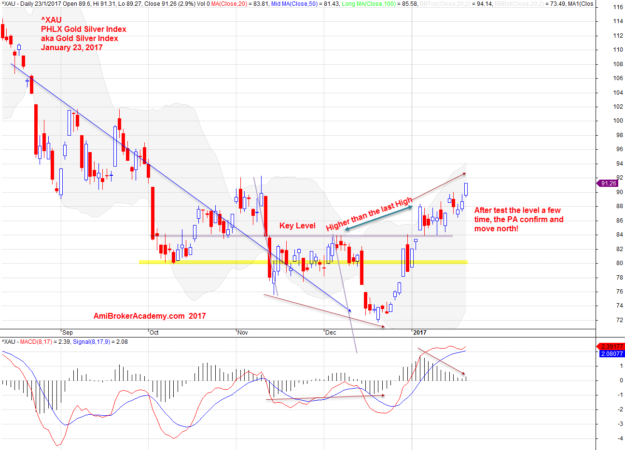
January 23, 2017 Gold Silver Index and MACD Indicator
Moses Stock Desk
AmiBrokerAcademy.com
Disclaimer:
The discussion here is for educational purposes only. All information, data, symbols and trading ideas discussed hereby are the author or authors intend to demonstrate or illustrate purposes only. These are not recommendations or advice. It is not to be construed or intended as providing trading or legal advice.
Besides that this discussion is not an offer or solicitation of any kind in any jurisdiction where any AmiBrokerAcademy.com or its affiliate is try to do business.
Please note that active trading is not suitable for everyone. Any decisions you make about your trading or investment are important to you and your family, therefore should be made in consultation with a competent financial advisor or professional. We are not financial advisor and do not claim to be one.
Any views expressed here-in are not necessarily those held by amibrokeracademy.com.