June 21, 2014
Moses Stock Corner – Thought and Notes of Trading
Up Trend or Down Trend
How do you tell the market is up trend or down trend? The enclosed Dow Jones Industrial Average, ^DJI daily chart is a typical up trend. A simple way to recognize an up trend is when the price action of the chart is travel from bottom left to top right. The reverse is down trend.
The market is moving in zigzag and not in straight line.
Resistance turns Support, ^DJI Daily Chart has demonstrated a nice example on Resistance and Support. In the chart, we found double bottom, reversal. The Bull Trap resulted a pull back. Will the market continue to agree on resistance turn support again to push the market towards north. ??
Will the Dow Jones continues to move north? Will see.
Dow Jones Industrial Average Daily Chart
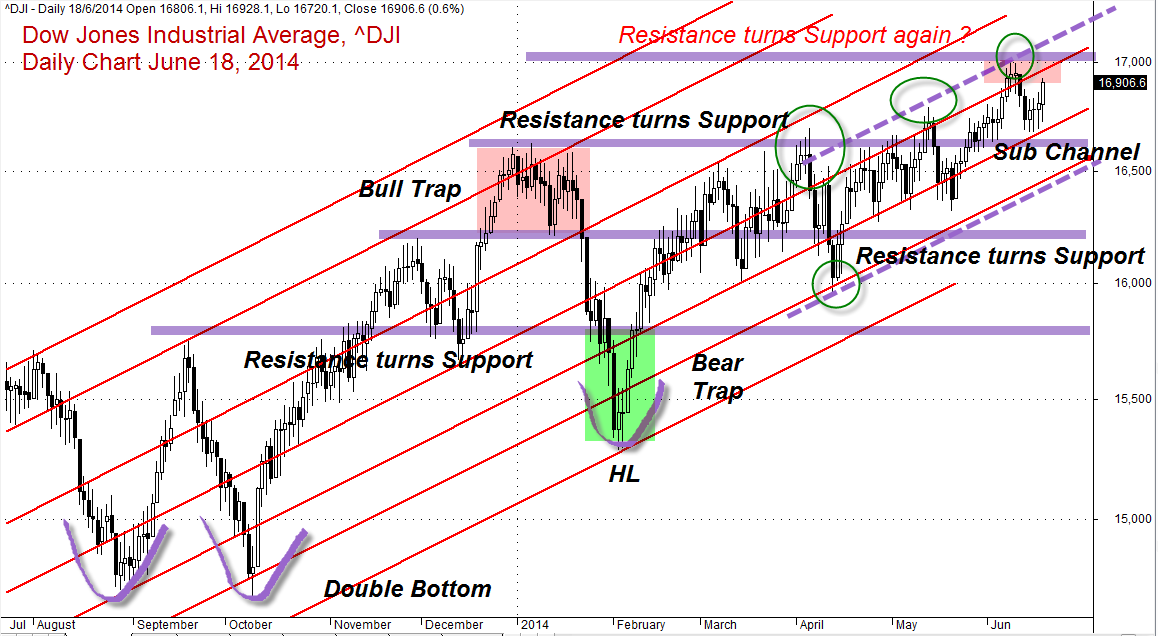
US Stock Benchmark, Dow Jones Industrial Average, ^DJI Daily Chart June 18, 2014
.
Thanks for visiting the site, AmiBrokerAcademy.com.
Moses
DISCLAIMER
Information provided here is of the nature of a general comment only and no intend to be specific for trading advice. It has prepared without regard to any particular investment objectives, financial situation or needs. Information should not be considered as an offer or enticement to buy, sell or trade.
You should seek advice from your broker, or licensed investment advisor, before taking any action.
Once again, the website does not guarantee any results or investment return based on the information and instruction you have read here. It should be used as learning aids only and if you decide to trade real money, all trading decision should be your own.