July 27, 2014
Moses’ Stock Column –- C52 ComfortDelGro Update July 24 Daily Chart
Chart Worth a Thousand Words. In the July 22, 2014 posting analyzing July 21, 2014 daily chart , we were wondering what will happen after the price action closed inside the Bollinger bands upper band.
The price action has breakout the resistance, and turn resistance to support. Subsequently, the following three days July 22, 23 and 24, the traders were indecision; three Doji candlesticks. All the candlesticks were closed inside upper Bollinger bands.
Chart (Picture) worth a thousand words. Will geometry pattern AB = CD bearish pattern happen? Will see.
ComfortDelGro Corporation Limited, C52 Daily Chart – July 24, 2014
Three Doji. MACD maybe forming divergence, forming the lower high. But, we need to wait till the turning is formed. MACD signals are just like thunder and lightning. It warns that might be raining. It is wise to see raindrops to confirm that it is raining. So don’t jump the gun till you see the confirmation from price action; price action closed below the trendline.
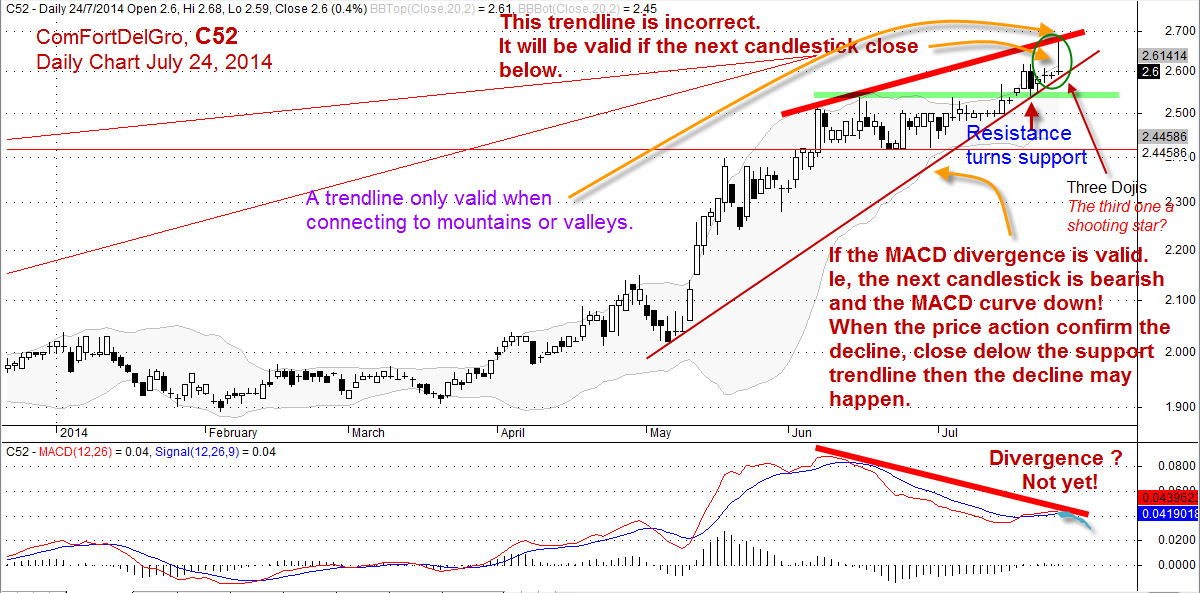
ComfortDelGro, C52 Daily Chart, July 24, 2014
Thanks for visiting the site, AmiBrokerAcademy.com.
Moses
DISCLAIMER
Information provided here is of the nature of a general comment only and no intend to be specific for trading advice. It has prepared without regard to any particular investment objectives, financial situation or needs. Information should not be considered as an offer or enticement to buy, sell or trade.
You should seek advice from your broker, or licensed investment advisor, before taking any action.
Once again, the website does not guarantee any results or investment return based on the information and instruction you have read here. It should be used as learning aids only and if you decide to trade real money, all trading decision should be your own.