27 May 2019
Welcome!
Welcome to AmiBrokerAcademy.com free MACD US stock screener. My name is Moses. We will be running this MACD scan as often as we can. This scanner will run on a daily basis to help traders filter the stocks that are listing in US. Of course, we will also do stock analysis.
The MACD scan here will only identify stocks that have MACD bullish or bearish signal. The scanner will only pick those stocks that have volume greater than 3,000K and have stock price more than 15 dollars.
Potentially for stocks that have bullish or bearish MACD signal could move in the near term. The signal will be correct till it is being proven wrong.
Our stock scanner script is written using AmiBroker AFL based upon the following MACD indicator rules.
Six types of MACD Signals:
- MACD line crosses above MACD signal – Bullish trend
- MACD line crosses above zero line – Bullish trend
- MACD Histogram +ve Divergence – Bullish trend
- MACD line crosses below MACD signal – Bearish trend
- MACD line crosses below zero line – Bearish trend
- MACD Histogram -ve Divergence – Bearish trend
Popular Technical Indicator
MACD is a popular technical indicator that identifies trend and potential reversal.
The benefit of any scanner is to replace the human effort in reviewing the stocks one at a time. It only takes a few minutes for the screener script to go through the entire database which contains more than six hundred equities listed in Singapore Stock Exchange or less than fifteen minutes to go nearly seven thousand stock of US stocks in the database. Compare it to a manual effort, assuming if it only takes 5 minutes per stock, with six hundred stocks to review. It will be more than 3000 minutes in this case. It will equal to 50 plus hours which means more than two days. Wow!
For those we do not know what MACD is.
Moving Average Convergence Divergence, MACD
MACD was developed by Gerald Appel in the late seventies.
- MACD stands for Moving Average Convergence Divergence, the MACD line (red line or called fast line) and MACD signal line (blue line, or called slow line).
- MACD Bullish Signal Line Cross: MACD bullish signal when red line crosses above the blue line or MACD line crosses above zero line.
- MACD Bearish Signal Line Cross: MACD bearish signal when blue line crosses below red line or MACD line crosses below zero line.
MACD Scan
These are stocks picked for today.
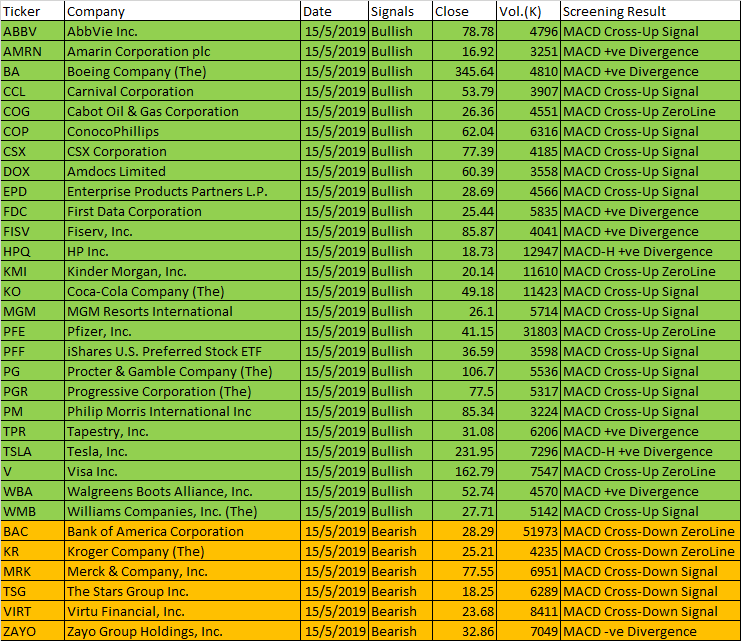
May 15 2019 AFL Script Generated One-day U.S. Stock MACD Signals
| Ticker | Company | Date | Signals | Close | Vol.(K) | Screening Result |
| ABBV | AbbVie Inc. | 15/5/2019 | Bullish | 78.78 | 4796 | MACD Cross-Up Signal |
| AMRN | Amarin Corporation plc | 15/5/2019 | Bullish | 16.92 | 3251 | MACD +ve Divergence |
| BA | Boeing Company (The) | 15/5/2019 | Bullish | 345.64 | 4810 | MACD +ve Divergence |
| CCL | Carnival Corporation | 15/5/2019 | Bullish | 53.79 | 3907 | MACD Cross-Up Signal |
| COG | Cabot Oil & Gas Corporation | 15/5/2019 | Bullish | 26.36 | 4551 | MACD Cross-Up ZeroLine |
| COP | ConocoPhillips | 15/5/2019 | Bullish | 62.04 | 6316 | MACD Cross-Up Signal |
| CSX | CSX Corporation | 15/5/2019 | Bullish | 77.39 | 4185 | MACD Cross-Up Signal |
| DOX | Amdocs Limited | 15/5/2019 | Bullish | 60.39 | 3558 | MACD Cross-Up Signal |
| EPD | Enterprise Products Partners L.P. | 15/5/2019 | Bullish | 28.69 | 4566 | MACD Cross-Up Signal |
| FDC | First Data Corporation | 15/5/2019 | Bullish | 25.44 | 5835 | MACD +ve Divergence |
| FISV | Fiserv, Inc. | 15/5/2019 | Bullish | 85.87 | 4041 | MACD +ve Divergence |
| HPQ | HP Inc. | 15/5/2019 | Bullish | 18.73 | 12947 | MACD-H +ve Divergence |
| KMI | Kinder Morgan, Inc. | 15/5/2019 | Bullish | 20.14 | 11610 | MACD Cross-Up ZeroLine |
| KO | Coca-Cola Company (The) | 15/5/2019 | Bullish | 49.18 | 11423 | MACD Cross-Up Signal |
| MGM | MGM Resorts International | 15/5/2019 | Bullish | 26.1 | 5714 | MACD Cross-Up Signal |
| PFE | Pfizer, Inc. | 15/5/2019 | Bullish | 41.15 | 31803 | MACD Cross-Up ZeroLine |
| PFF | iShares U.S. Preferred Stock ETF | 15/5/2019 | Bullish | 36.59 | 3598 | MACD Cross-Up Signal |
| PG | Procter & Gamble Company (The) | 15/5/2019 | Bullish | 106.7 | 5536 | MACD Cross-Up Signal |
| PGR | Progressive Corporation (The) | 15/5/2019 | Bullish | 77.5 | 5317 | MACD Cross-Up Signal |
| PM | Philip Morris International Inc | 15/5/2019 | Bullish | 85.34 | 3224 | MACD Cross-Up Signal |
| TPR | Tapestry, Inc. | 15/5/2019 | Bullish | 31.08 | 6206 | MACD +ve Divergence |
| TSLA | Tesla, Inc. | 15/5/2019 | Bullish | 231.95 | 7296 | MACD-H +ve Divergence |
| V | Visa Inc. | 15/5/2019 | Bullish | 162.79 | 7547 | MACD Cross-Up ZeroLine |
| WBA | Walgreens Boots Alliance, Inc. | 15/5/2019 | Bullish | 52.74 | 4570 | MACD +ve Divergence |
| WMB | Williams Companies, Inc. (The) | 15/5/2019 | Bullish | 27.71 | 5142 | MACD Cross-Up Signal |
| BAC | Bank of America Corporation | 15/5/2019 | Bearish | 28.29 | 51973 | MACD Cross-Down ZeroLine |
| KR | Kroger Company (The) | 15/5/2019 | Bearish | 25.21 | 4235 | MACD Cross-Down ZeroLine |
| MRK | Merck & Company, Inc. | 15/5/2019 | Bearish | 77.55 | 6951 | MACD Cross-Down Signal |
| TSG | The Stars Group Inc. | 15/5/2019 | Bearish | 18.25 | 6289 | MACD Cross-Down Signal |
| VIRT | Virtu Financial, Inc. | 15/5/2019 | Bearish | 23.68 | 8411 | MACD Cross-Down Signal |
| ZAYO | Zayo Group Holdings, Inc. | 15/5/2019 | Bearish | 32.86 | 7049 | MACD -ve Divergence |
Moses US Stock Scan
AmiBroker Academy.com
Disclaimer:
The above result is for illustration purpose. It is not meant to be used for buy or sell decision. We do not recommend any particular stocks on our website. If particular stocks of such are mentioned, they are meant as illustration or demonstration of Amibroker as a powerful charting software or MACD scanner. Amibroker can program to scan the stocks that have MACD buy or sell signals.
These are script generated signals. Not all scan results are shown here. The MACD signal should use with price action and confirmation. Users must understand what MACD and price action are all about before using them. If necessary you should attend a course to learn more about Technical Analysis (TA) and Moving Average Convergence Divergence, MACD.
Once again, the website does not guarantee any results or investment return based on the information and instruction you have read here. It should be used as learning aids only and if you decide to trade real money, all trading decision should be your own, and you should take your own responsibility.
Besides that all setup may fail.